1. Navigation bar at the top of the home page
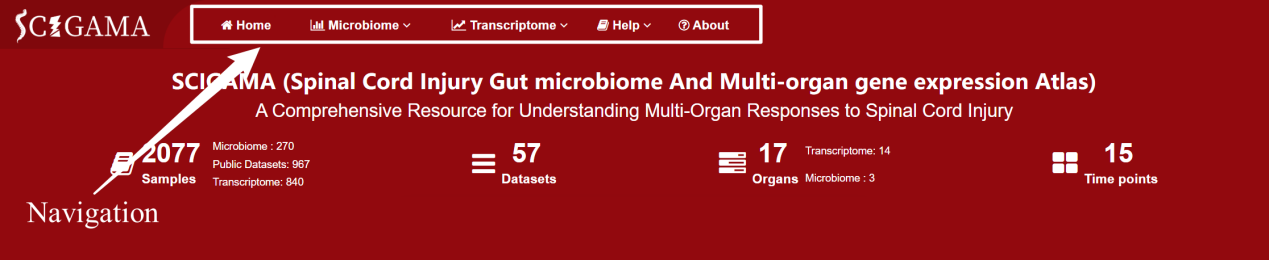
1.1 Home: Click here to return to the homepage.
1.3 Transcriptime: This section displays transcriptomic data and corresponding analysis functions, including Public Datasets, Multi-Organ, and Analysis.
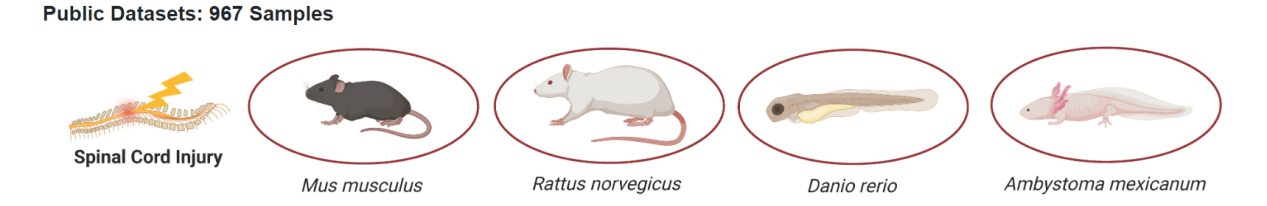
1.3.1 Public Datasets: By hovering the mouse over this section, SCIGAMA displays different types of data, including Mircoarray as well as RNA-seq data. The Mircoarray as well as RNA-seq data consists of data from 4 SCI model animals, Ambystoma mexicanum, Danio rerio, Mus musculus, and Rattus norvegicus.
1.3.2 Multi-organ: Multi-organ: Hover over the section displays the "Search by Gene" and "Injury Related Genes" sections. Here, users can enter their genes of interest to observe how their expression changes over time after the SCI and across different organs. The data is sourced from our RNA-seq data.
1.3.3 Analysis: This section includes four analysis functions: “Trend”, “Expression”, “Correlation”, and “Function”.
1.3.3.1 Trend: Clicking on this section, relying on Self-Generated RNA-seq data, SCIMGAMA will show the user the trend change of gene expression in each organ after SCI.
1.3.3.2 Expression: Clicking on this section, relying on Self-Generated RNA-seq data, SCIGAMA will help users to perform differential expression analysis on their gene of interest.
1.3.3.3 Correlation: Clicking on this section, relying on Self-Generated RNA-seq data, SCIGAMA can help users to perform co-expression network analysis or correlation analysis on their genes of interest.
1.3.3.4 Function: By clicking on this section, relying on Self-Generated RNA-seq data, SCIGAMA will perform GSVA analysis on the genes entered by the users.
1.4 Help: This section contains tutorials on how to use each part of SCIGAMA to help users get the most out of SCIGAMA.
1.5 About: In the About section, users can obtain our contact information and specific information about SCIGAMA.
2.Search: Users can enter the name of a microorganism, gene name, GO term, KEGG pathway, or miRNA here and click the “Search” button to browse content of interest.

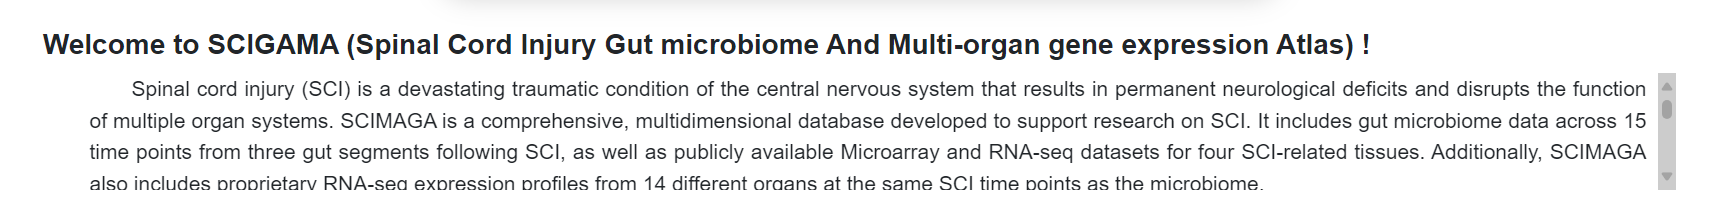
3.Welcome to SCIGAMA: When opening SCIGAMA for the first time, this section, located in the center of the home page, welcomes the users. At the same time, users can learn the main information about SCIGAMA and its main functions.
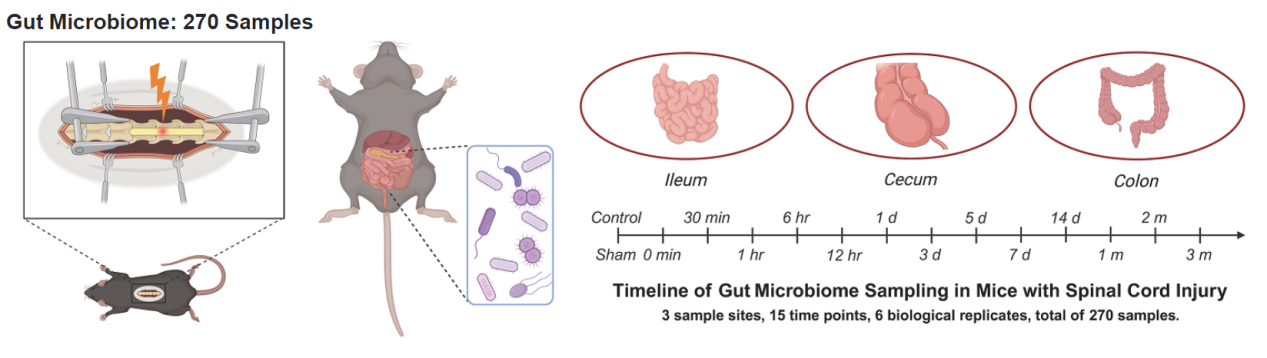
4. Gut Microbiome: The left side of this section shows a diagram illustrating the sampling of intestinal microorganisms, while the right side contains three intestinal images representing microbial data from the ileum, cecum, and colon, respectively. Users can click on the images of different intestinal sections to view the microbial abundance data for that section. In addition, users can click on a time point on the timeline to view the microbial abundance data for that time point.
5. Public Datasets: There are four images of animals in this section, representing each of the four species of animal sources of public data. Users can view gene expression data by clicking on the images of different animals. Upon clicking on an animal, the user will also need to confirm whether they want to view Microarray or RNA-seq data.
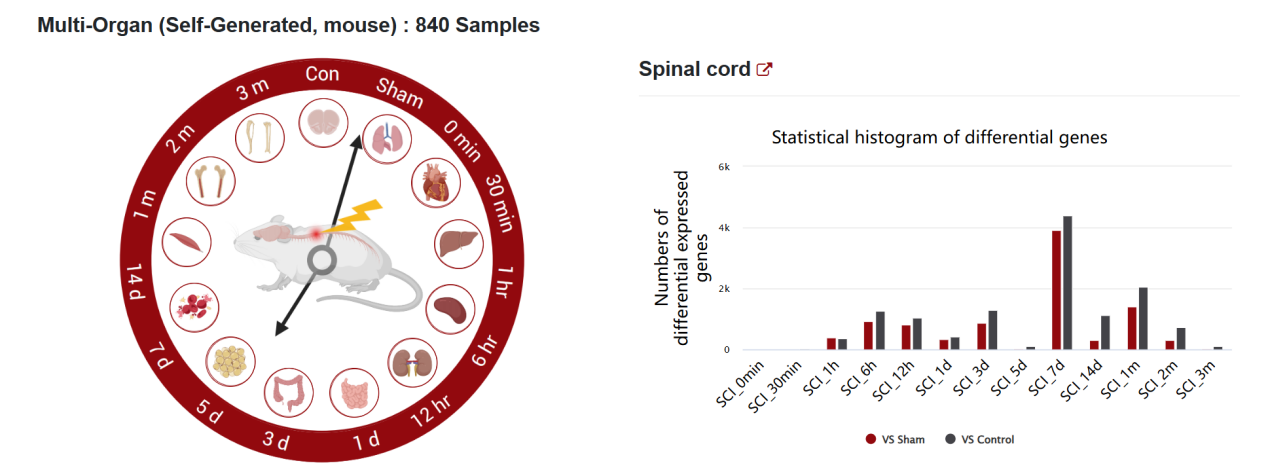
6. Multi-Organ (Self-Generated, mouse): On the timeline representing different time points post-spinal cord injury, there are icons representing various organs. Clicking these icons will display in the histogram on the right the number of differentially expressed genes compared to the Control or Sham group (Black bars: SCI groups compared to the control groups; Red bars: SCI groups compared to the sham groups). The respective organ can be viewed in the top left corner, and users can navigate to the "Injury related genes" section in Multi-Organ by clicking the share button next to the organ name.
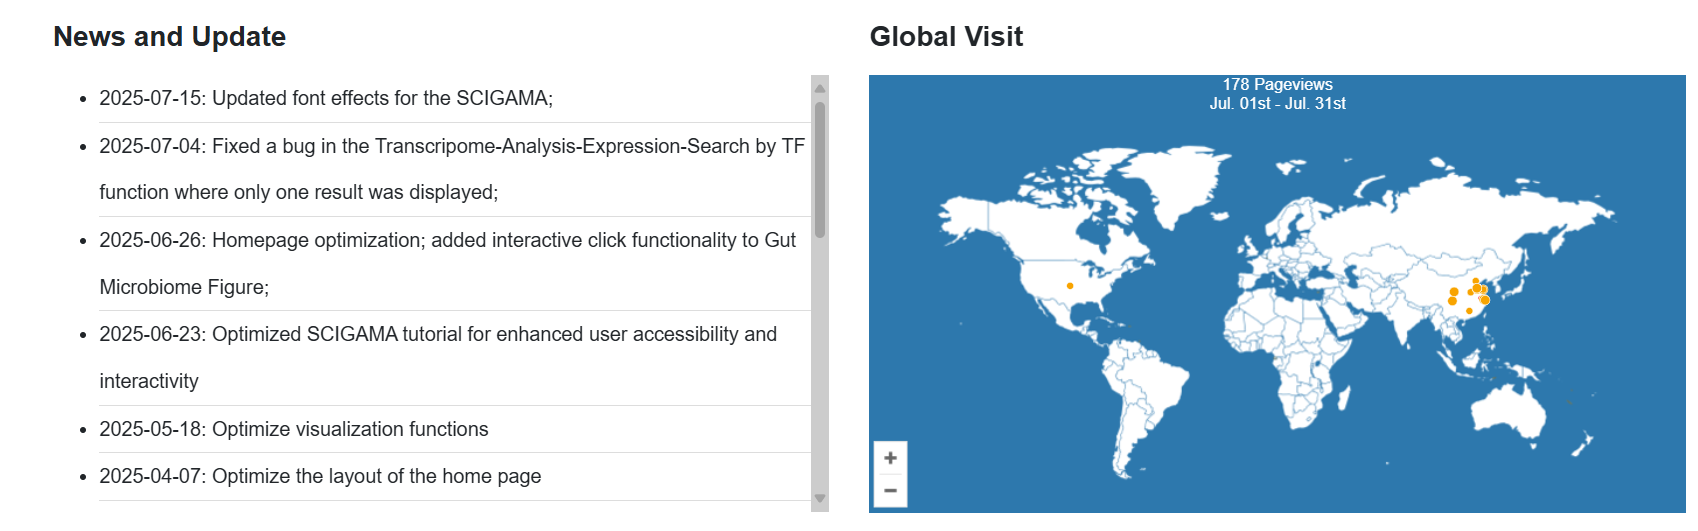
7. News and Update: This section presents the latest content of SCIGAMA.
8. Global Visit: Users can view the distribution and numbers of visitors to this database by clicking here.