In the “Public Datasets” section of “Transcriptome”, SCIGAMA will present users with its collection of public transcriptome data on SCI. These data include Microarray and RNA-seq data for 4 species, Ambystoma mexicanum, Danio rerio, Mus musculus, and Rattus norvegicus. Hover your mouse over “Transcriptome” in the navigation bar on the home page, and a submenu will appear in SCIGAMA. In the submenu, users can view SCI data for the above four model animals based on microarray data or RNA-seq data.
1.Microarray Section
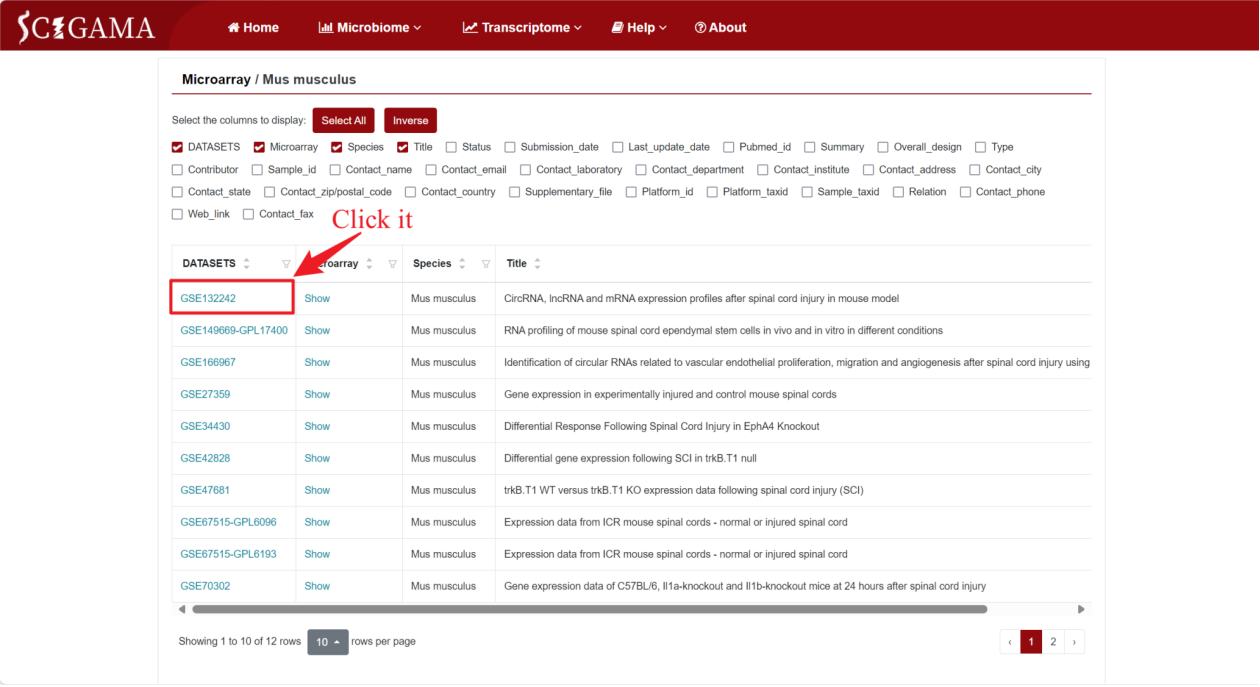
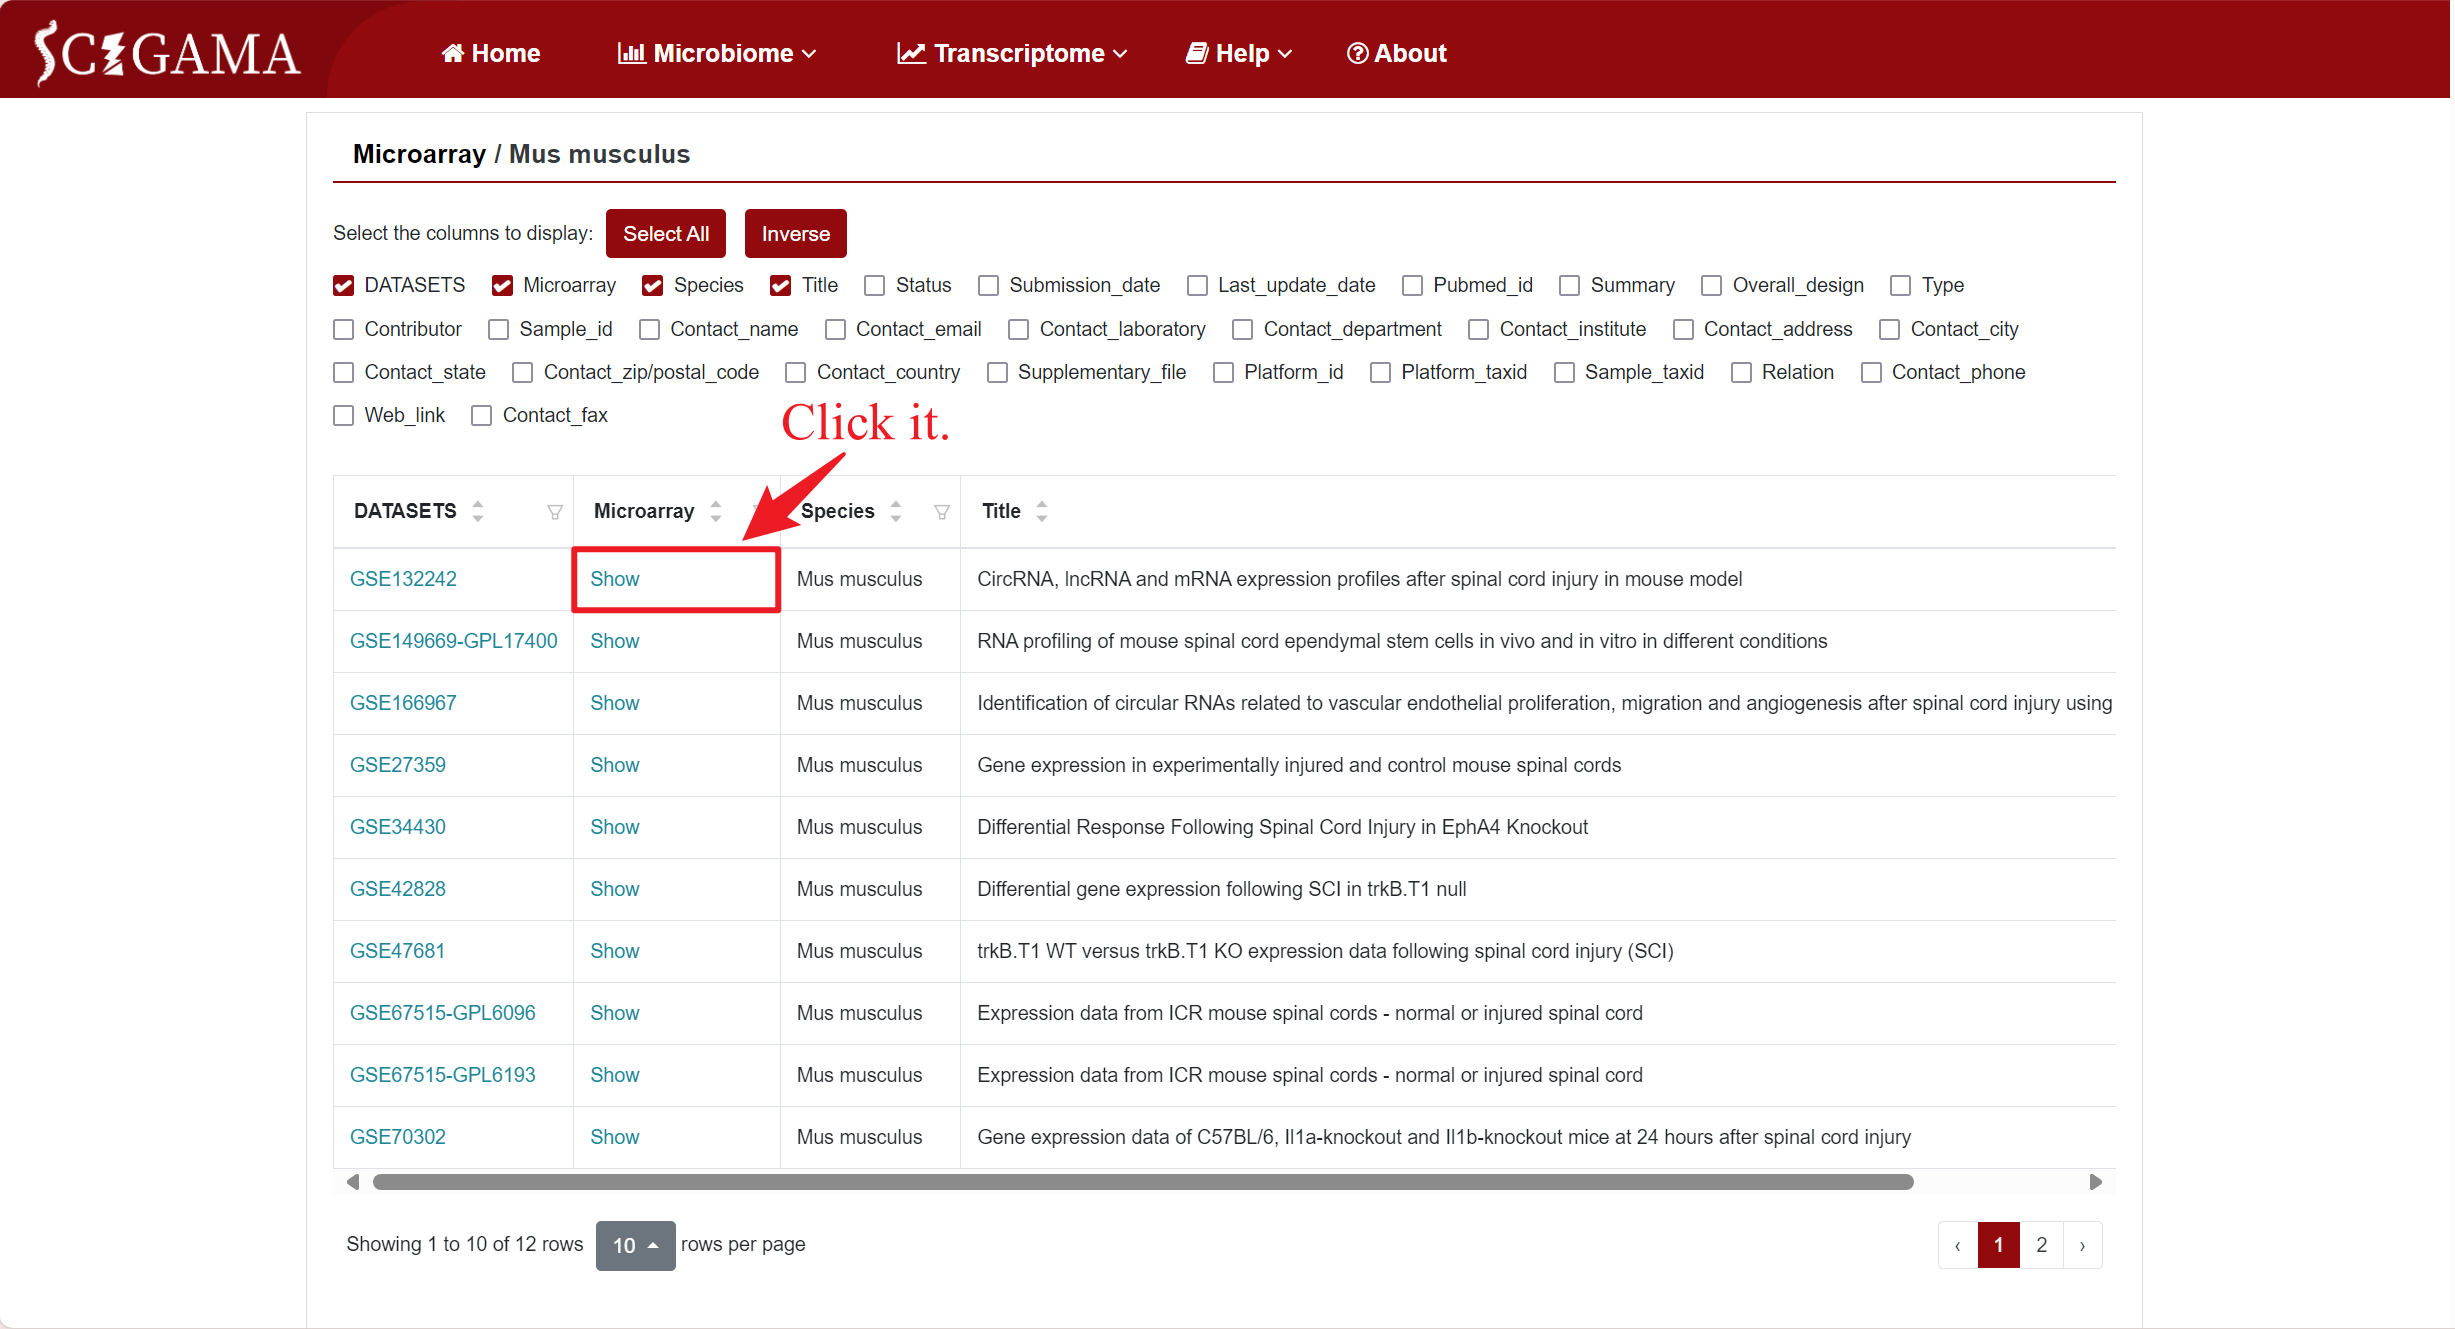
To demonstrate the Microarray Section, we will use the mouse (Mus musculus) as an example. Hover the mouse over “Transcriptome” in the home page navigation bar, then select ‘Microarray’ in the submenu under “Public Datasets”, and then select “Mus musculus”. After that, SCIGAMA will go to a new page where users can select the datasets they are interested in viewing. On this page, the user can display columns of information by checking conditions. SCIGAMA recommends that the user select at least DATASETS, Microarray, Species and Title, which are also displayed by SCIGAMA by default. If the user wants a brief overview of the information, they can simply focus on the DATASETS and Microarray columns. This section demonstrates an example of accessing microarray data for mouse GSE132242.
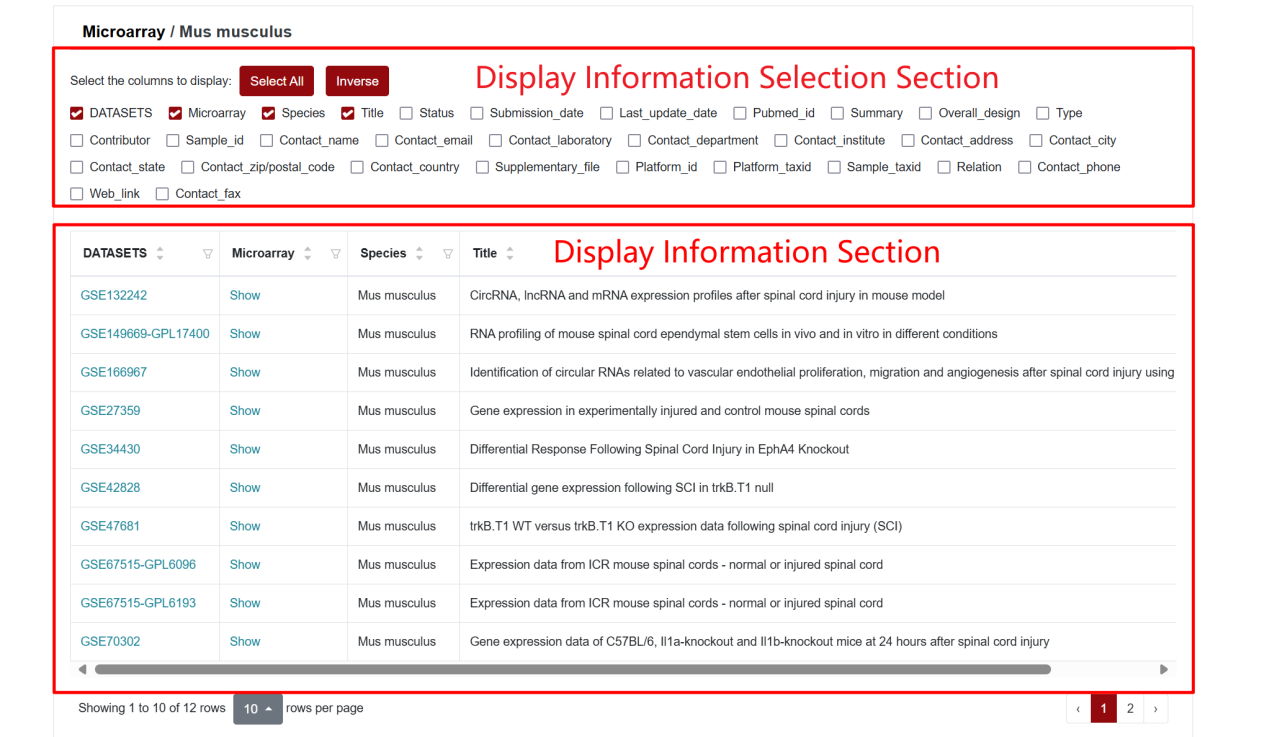
Columns and their descriptions in the results table.
| Column | Description of the column |
|---|---|
| DATASETS | Record the GEO Series ID, indicating the public data source. |
| Microarray | Clicking on this column allows users to view differentially expressed genes based on their selection of displaying information. |
| Title | Displays the title of the public data as it appears in the GEO database. |
| Type | Identifies the types of microarray data contained within the public dataset, such as non-coding RNAs. |
| BioProject | Displays the BioProject to which the public data belongs. |
| Platform_id | Provides the annotation file ID associated with this public dataset. |
| Contact_ + ... | Columns named in this format display the source and contact information for the public data. |
*Column names such as "Contact_email" or "Contact_department" enable you to reach out to the contributors of this data. Please note that all columns and their respective information originate from the GEO database, with the exception of DATASETS and Microarray.
1.1 DATASETS
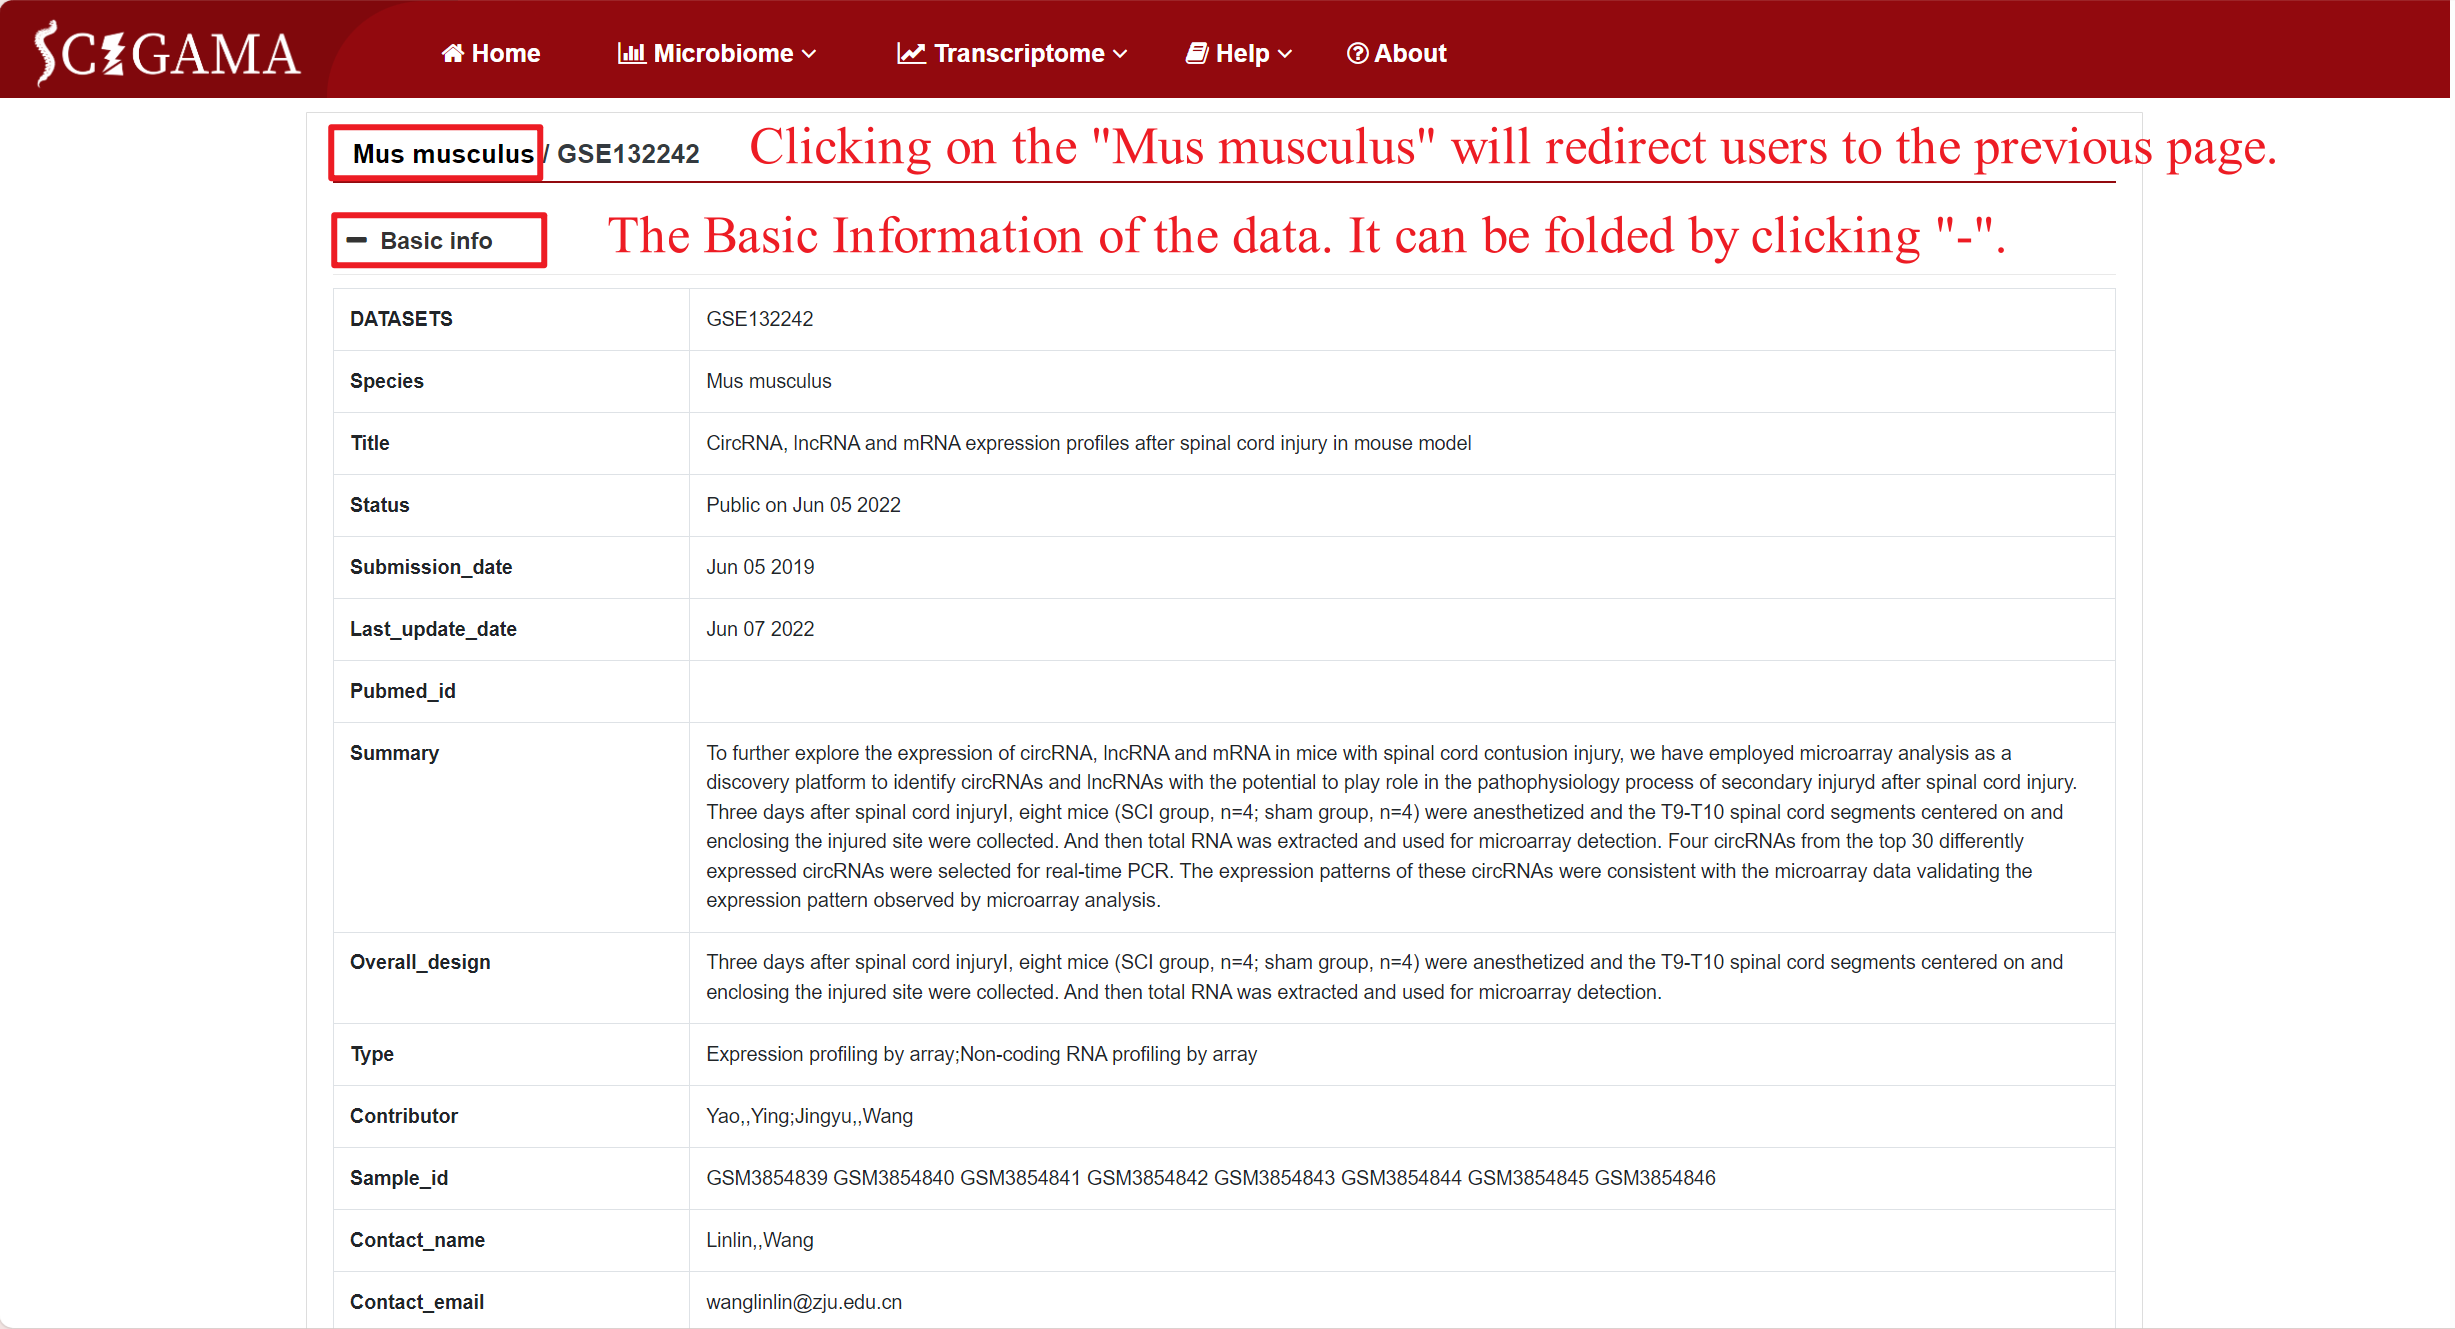
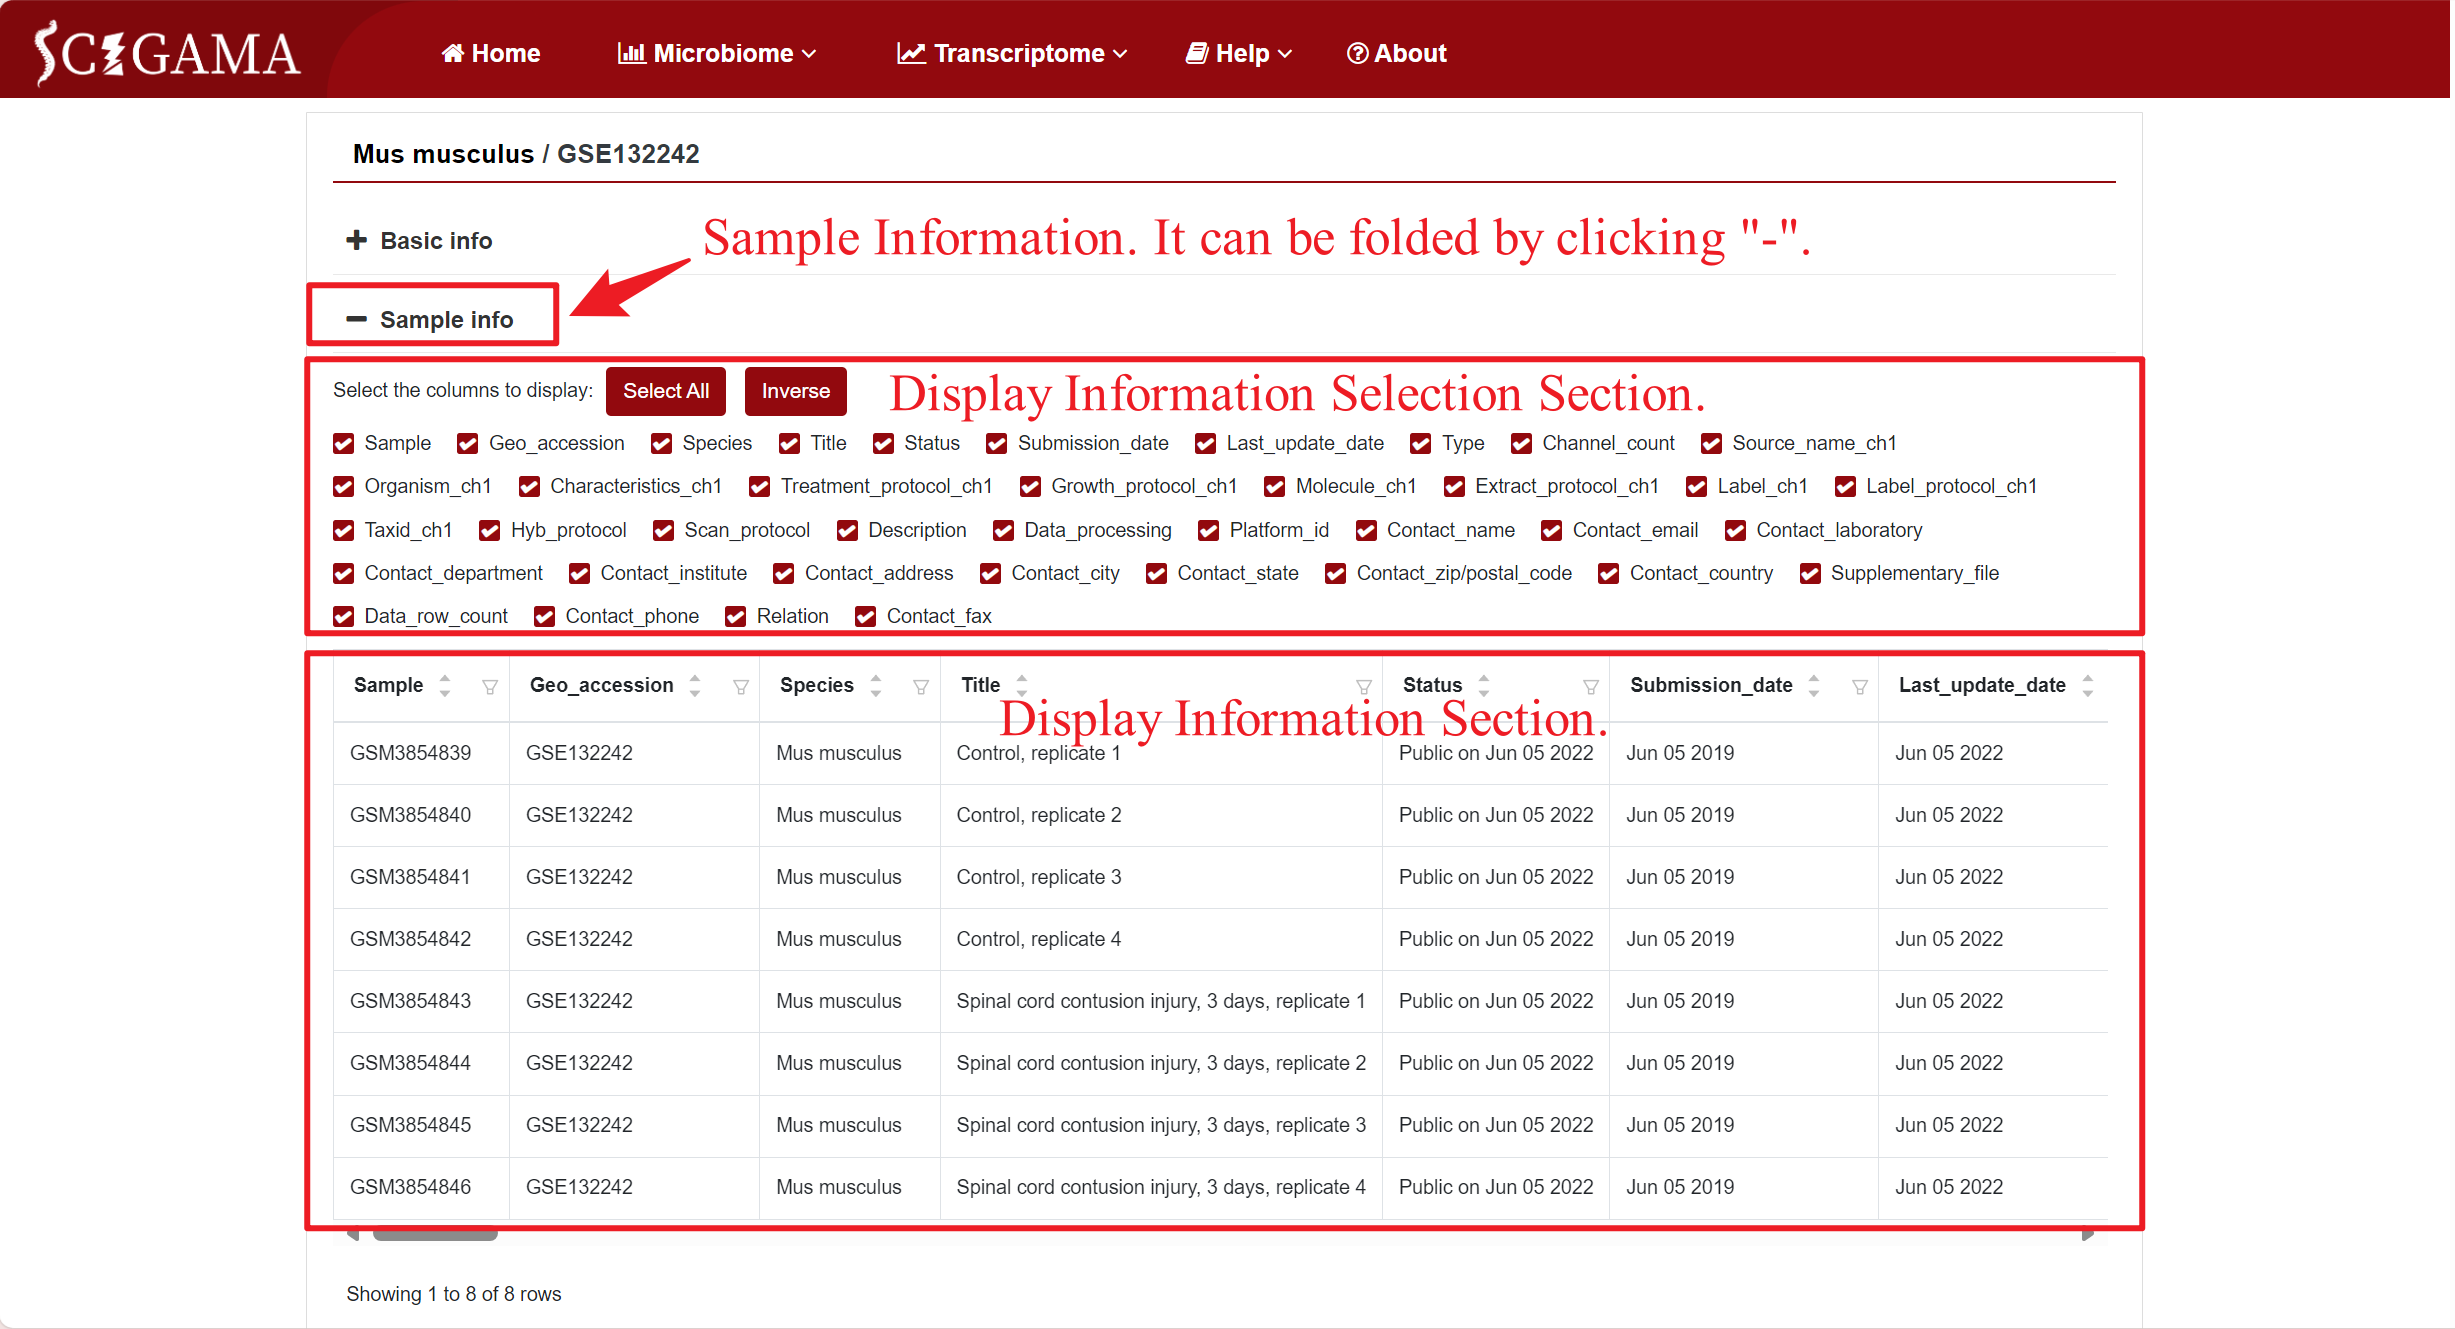
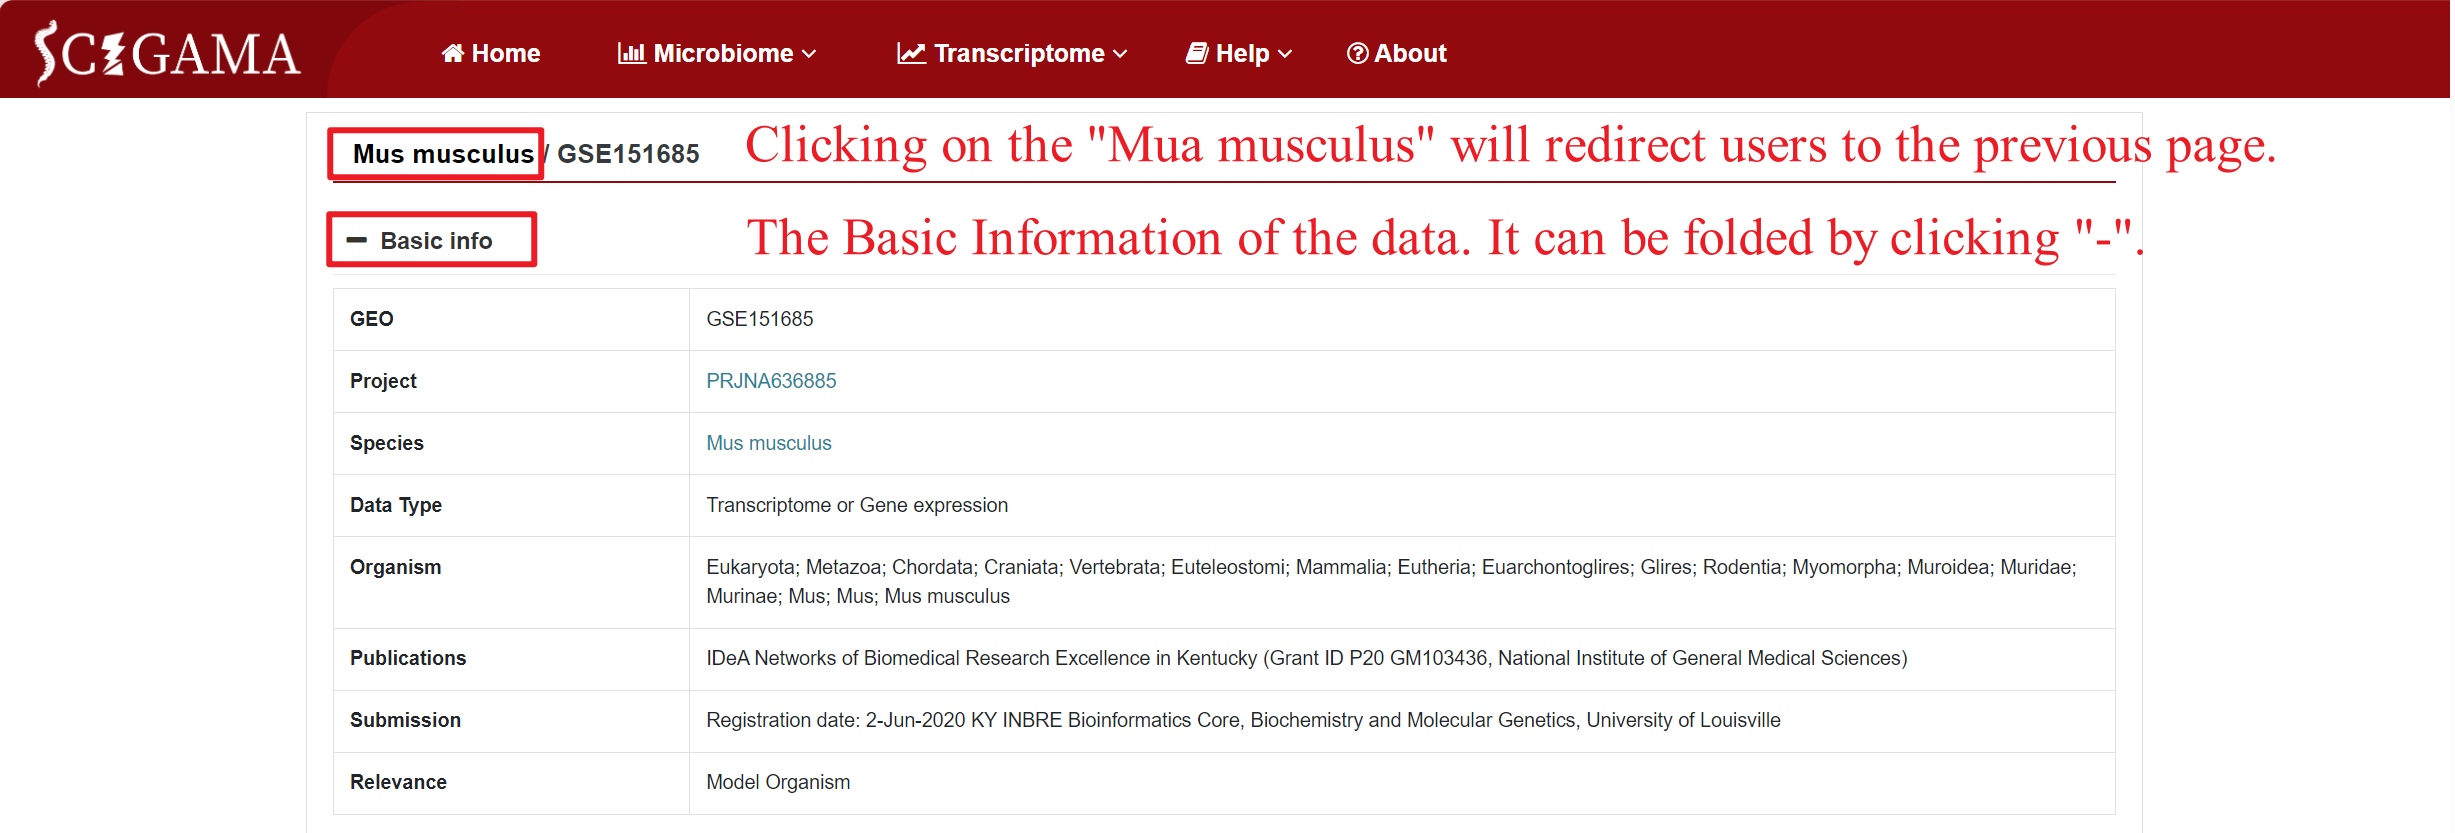
By clicking on the GSE number in the DATASETS column, SCIGAMA redirects users to a page that showcases comprehensive basic information about the public data for that specific GSE number, including Sample information that can be collapsed for ease of viewing, and clicking on the "Mus musculus" section will redirect the users to the previous page.
Sample information can also be displayed through changing the selection section. SCIGAMA recommend retaining at least the Sample and Title columns for viewing purposes. The Sample column includes the GSM number for each sample, while the Title column provides insight into their group.
1.2 Microarray
1.2.1 Selection of Microarray
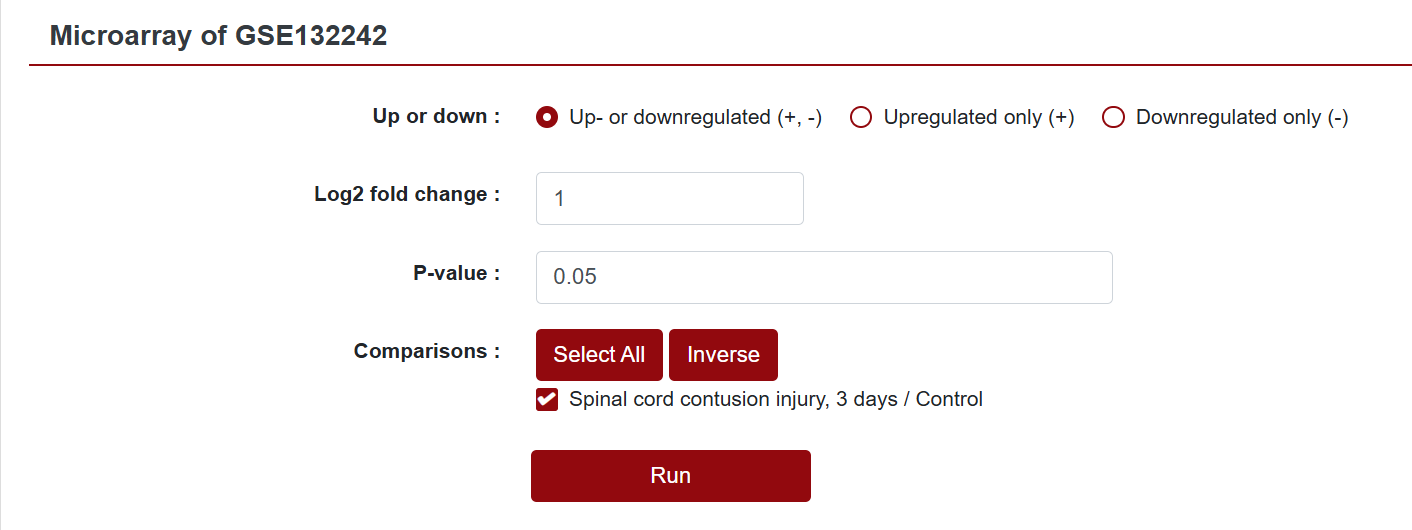
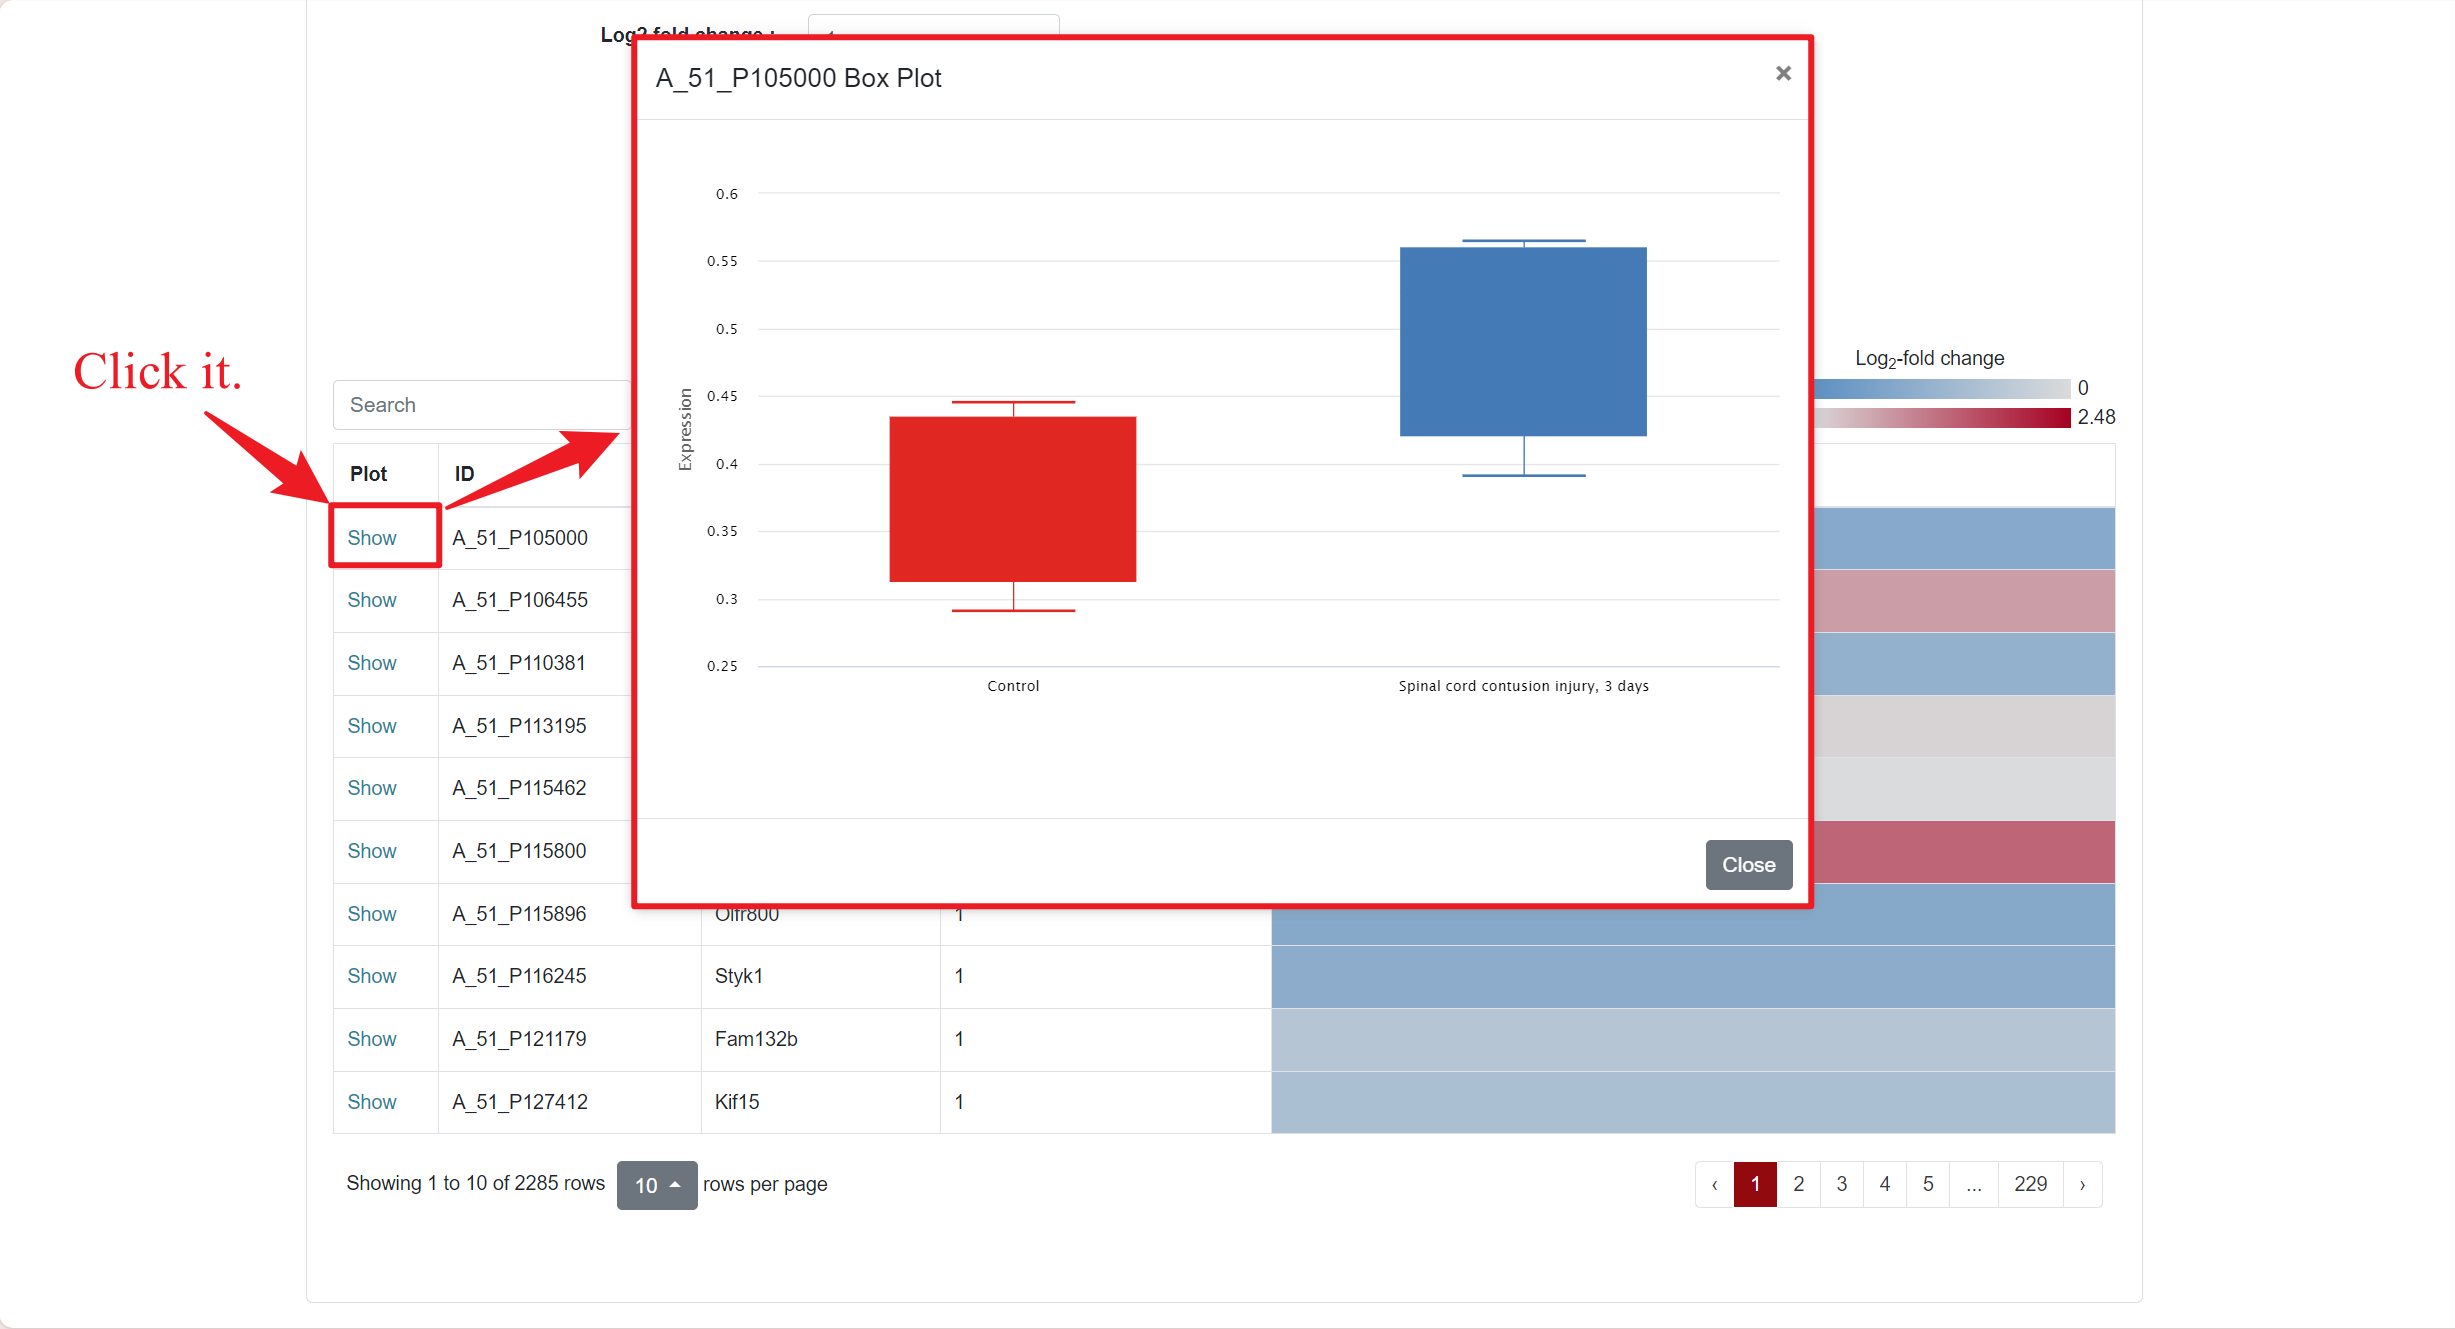
In the Microarray column, if users want to see the differentially expressed genes within a specific dataset, they can click "Show" to view it. This action will redirect users to a new page where they can further customize the data they intend to retrieve. SCIGAMA provides options for Up- or downregulated (+, -), Upregulated only (+) and Downregulated only (-), and we also support the personalisation of Log2 Fold Change absolute values and P-values, which default to 1 and 0.05 respectively. Finally, users can also change the displayed comparison results by setting the "Comparison" option to their desired comparison group. Once the preferences are set, click "Run" to obtain the desired results.
1.2.2 Results of Microarray
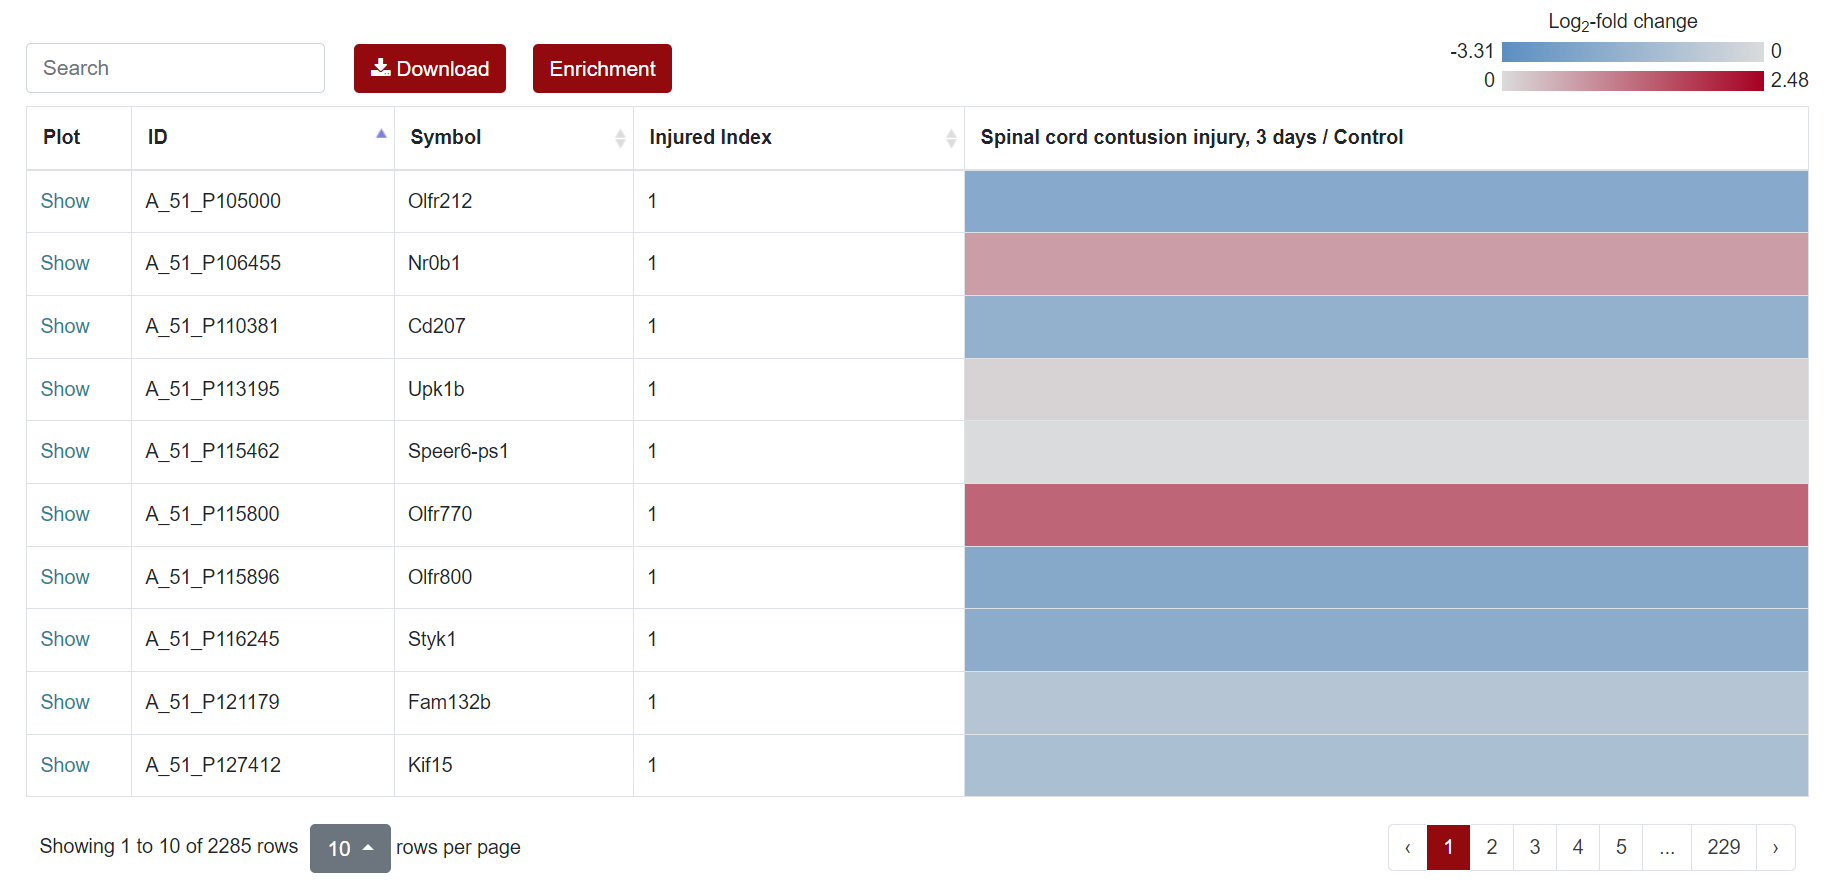
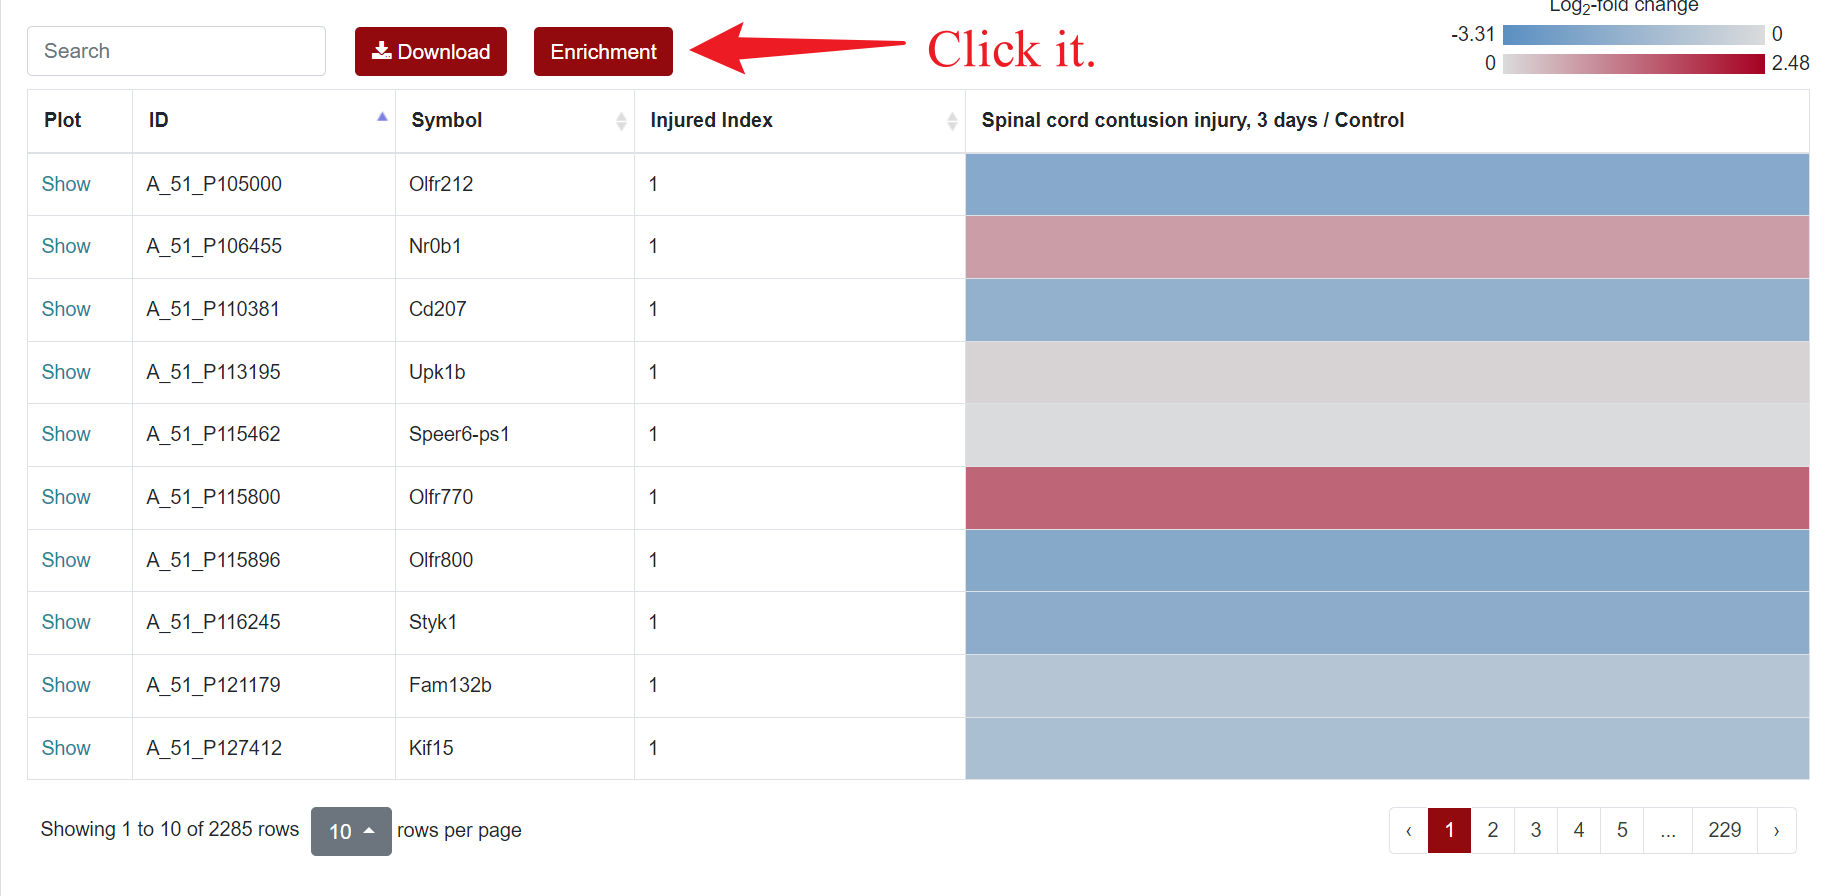
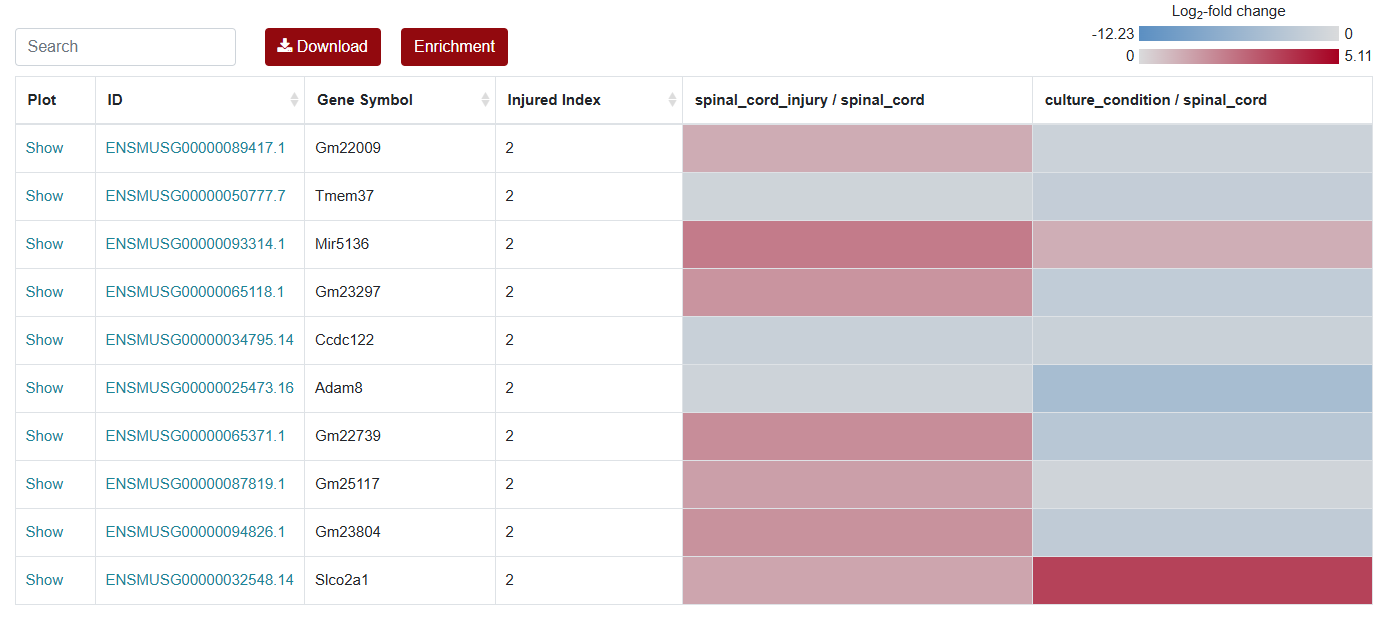
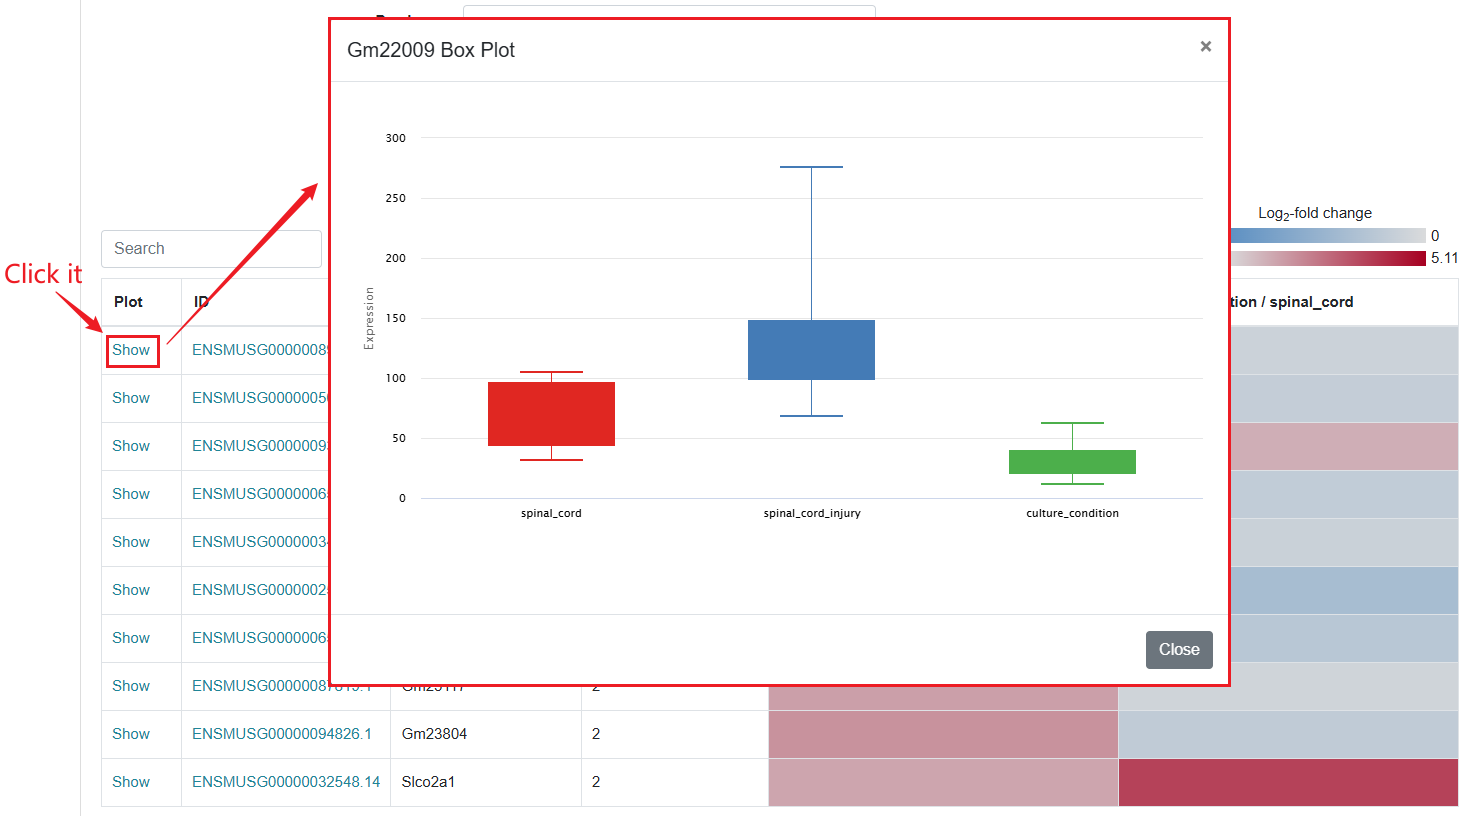
Regarding the presentation of differentially expressed genes, SCIGAMA has adopted the heatmap approach. At the top left of the results page, there is a "Search" box for users enabling they to quickly locate genes of interest; the Plot column showcases the expression status of each gene, utilizing a box plot to illustrate their expression patterns across different groups; ID stands for the name of the gene; Injured Index stands the number of groups that have the same differentially expressed gene; in the various "Comparison" columns, the column names indicate the comparative groups being analyzed; the color represents the differential expression status of the gene. In each "Comparison" columns, the name of column implies the comparative information of the groups; the color represents the differential expression of the gene, red means up-regulation, blue means down-regulation. The color of each gene represents the differential expression of the gene, red means up-regulation, blue means down-regulation. The shade of the color represents the size of the Log2 Fold Change, the larger the absolute value, the darker the color. When the mouse hovers over the color block of the corresponding gene in the "Comparison" column, the specific Log2 Fold Change and P-value of the gene will be displayed. Users can download the data corresponding to the heatmap by clicking on the 'Download' section.
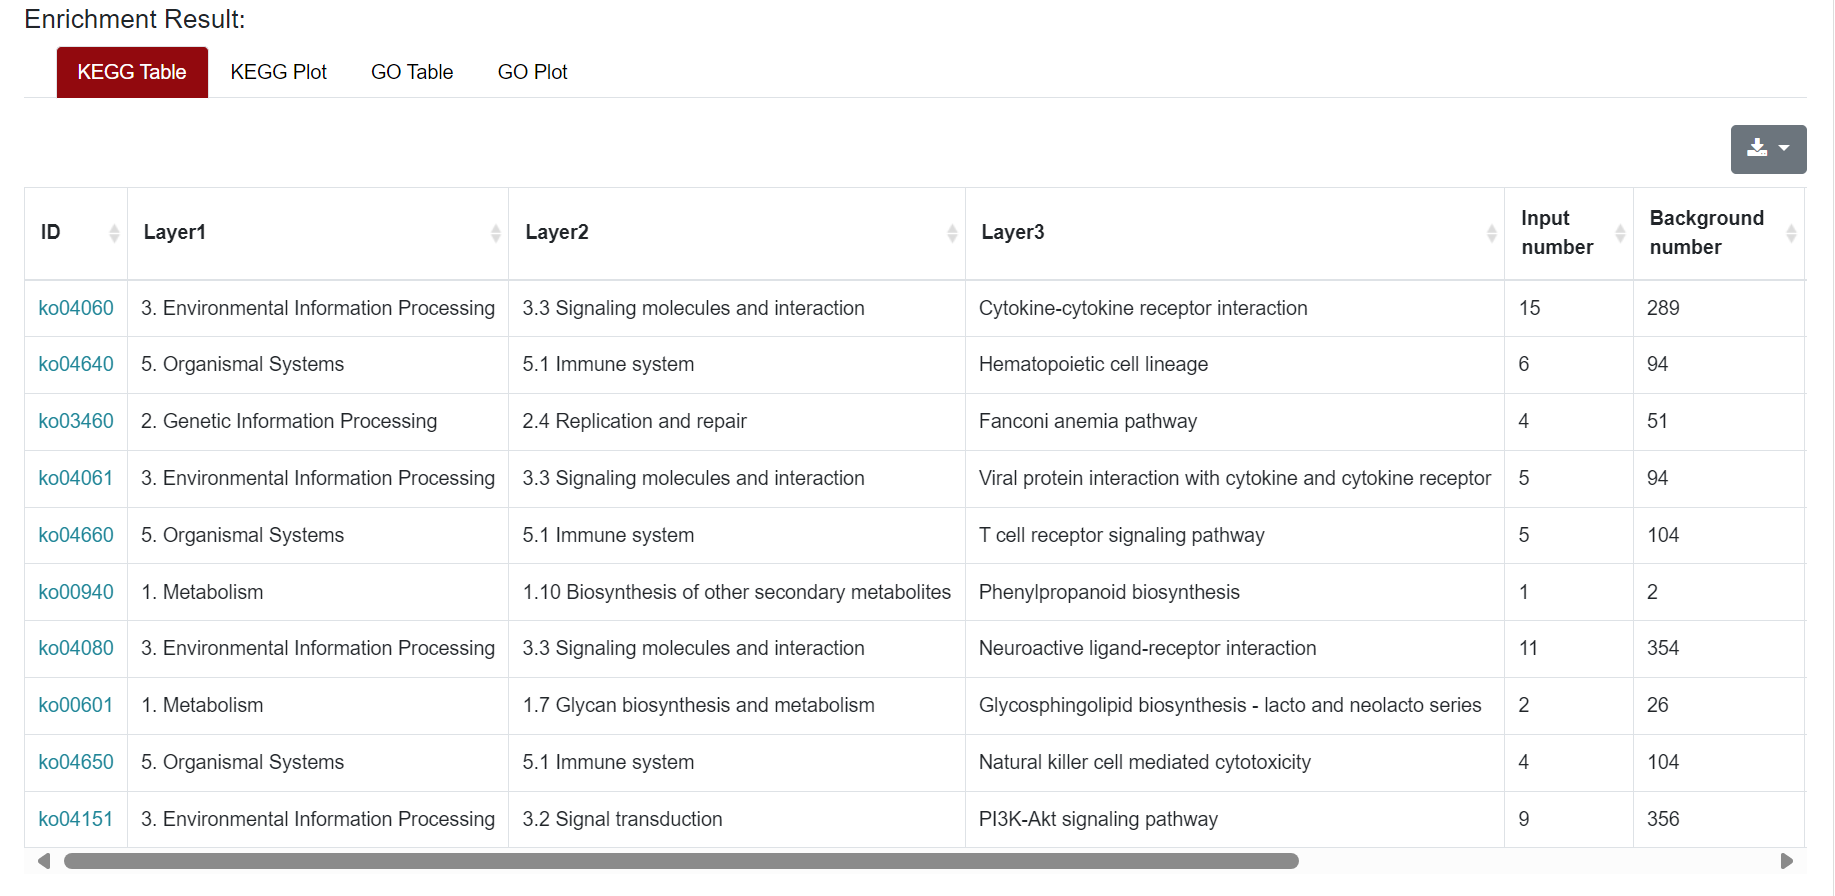
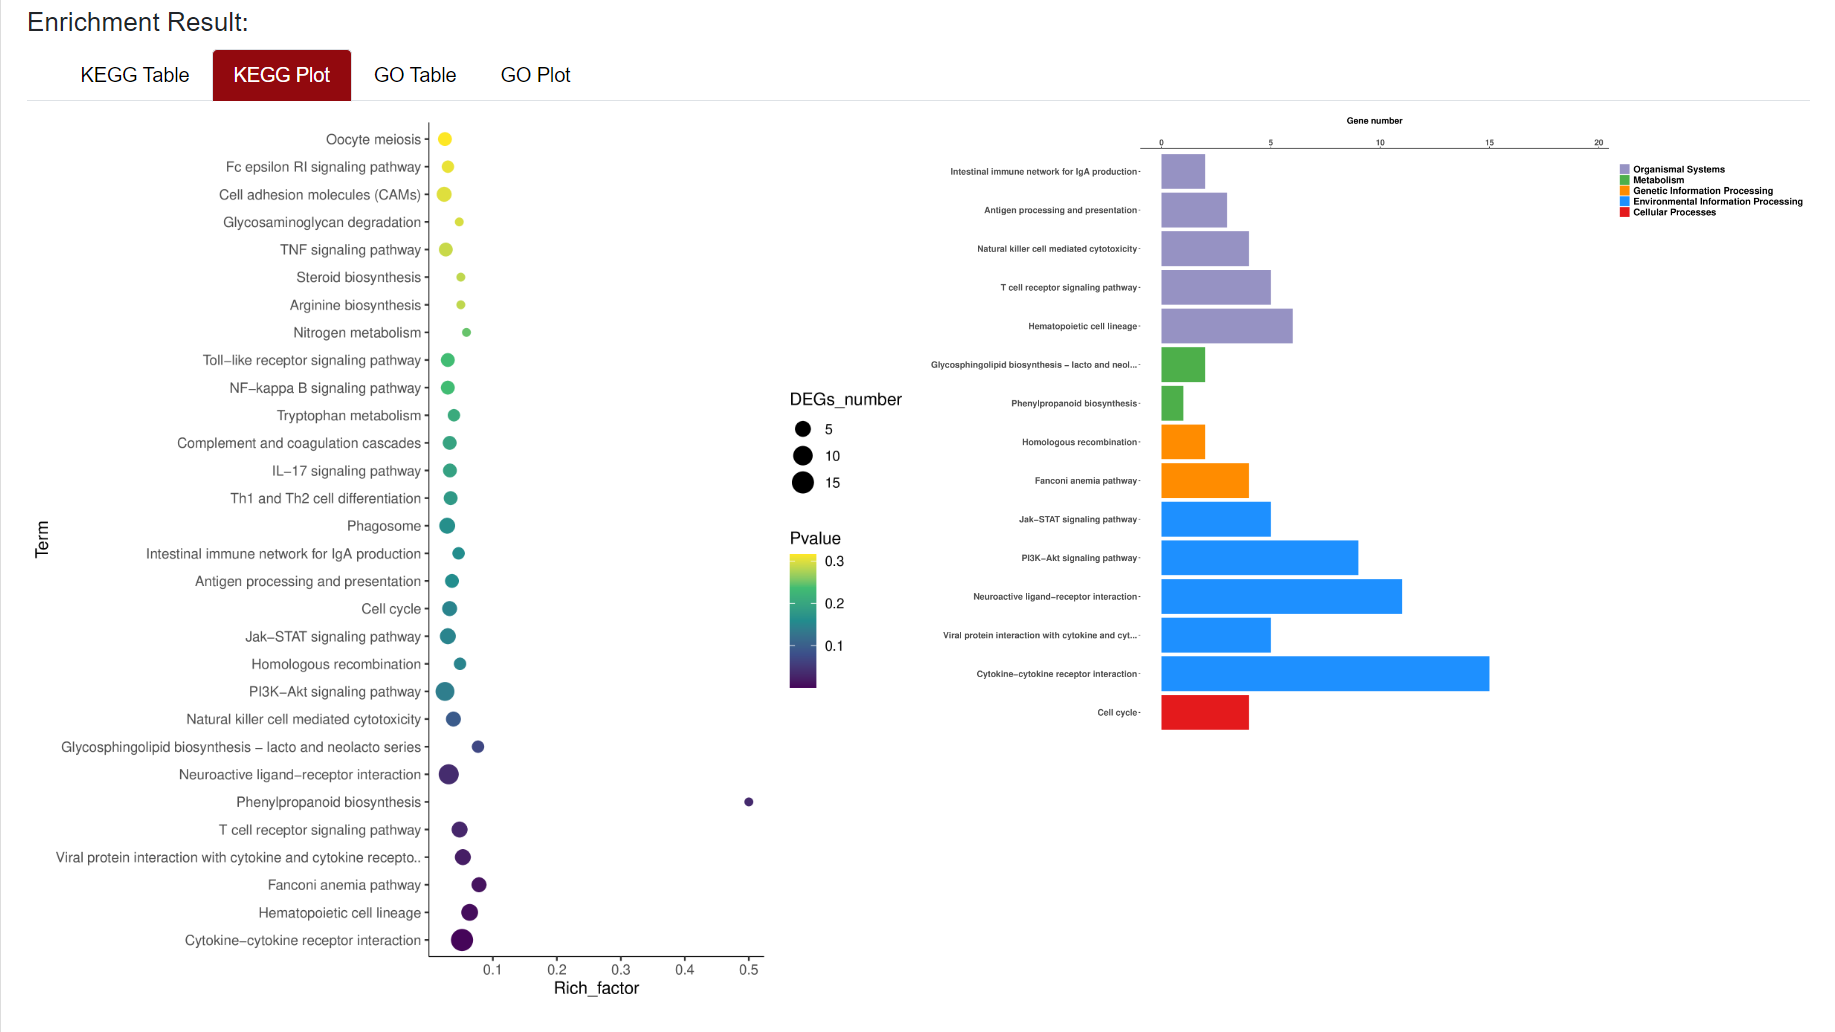
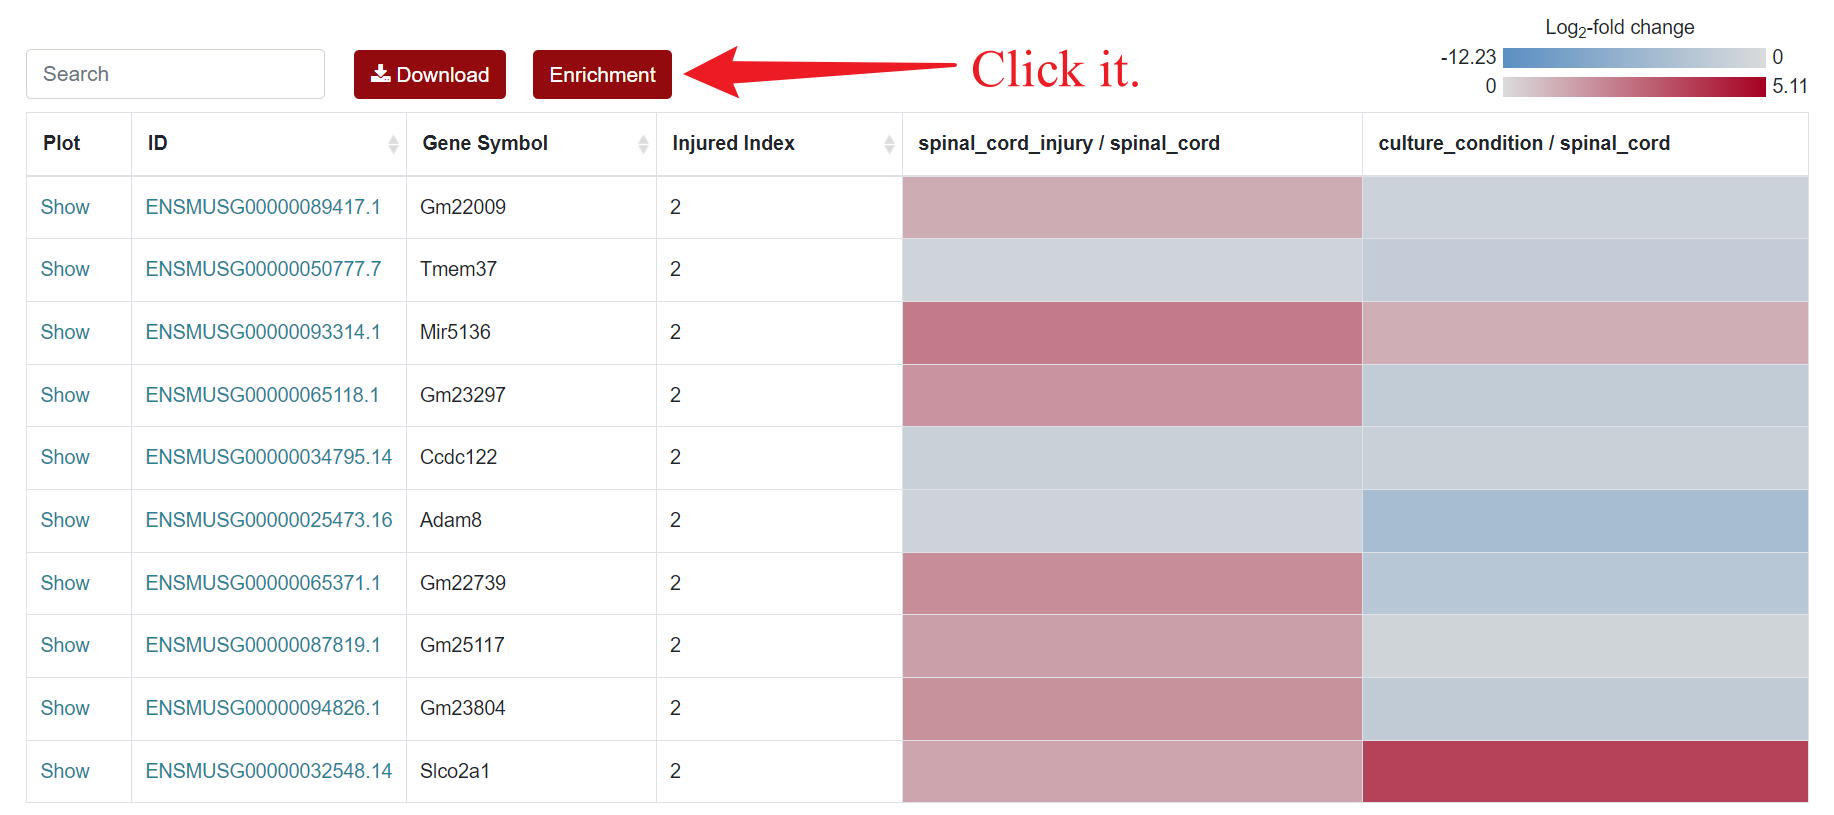
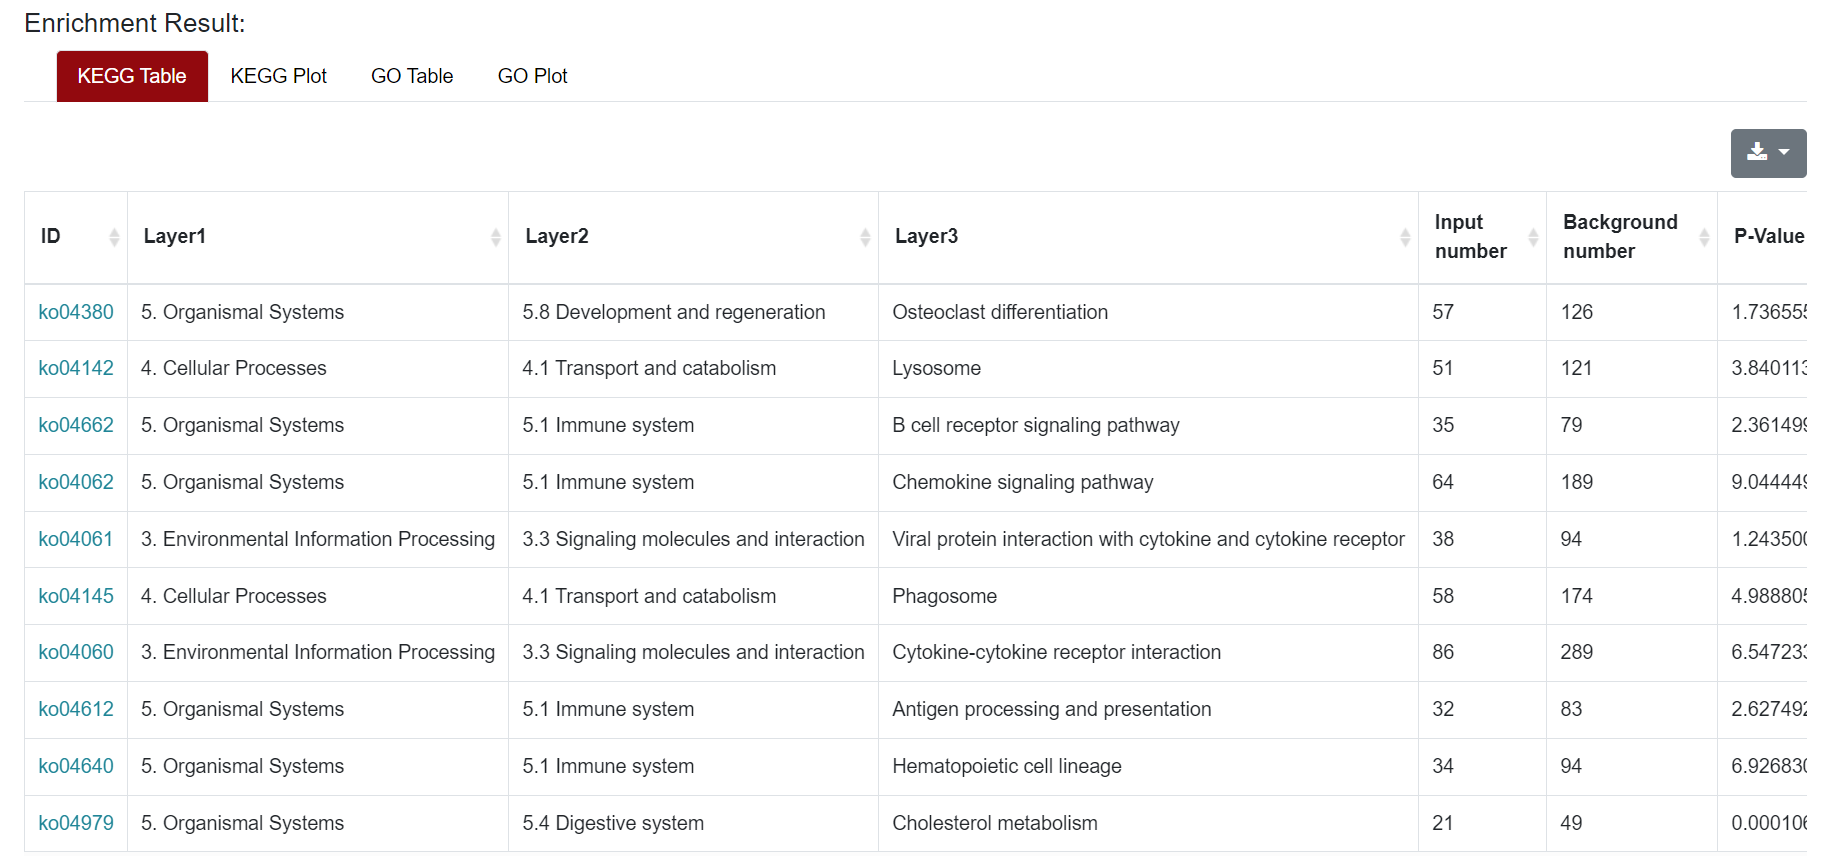
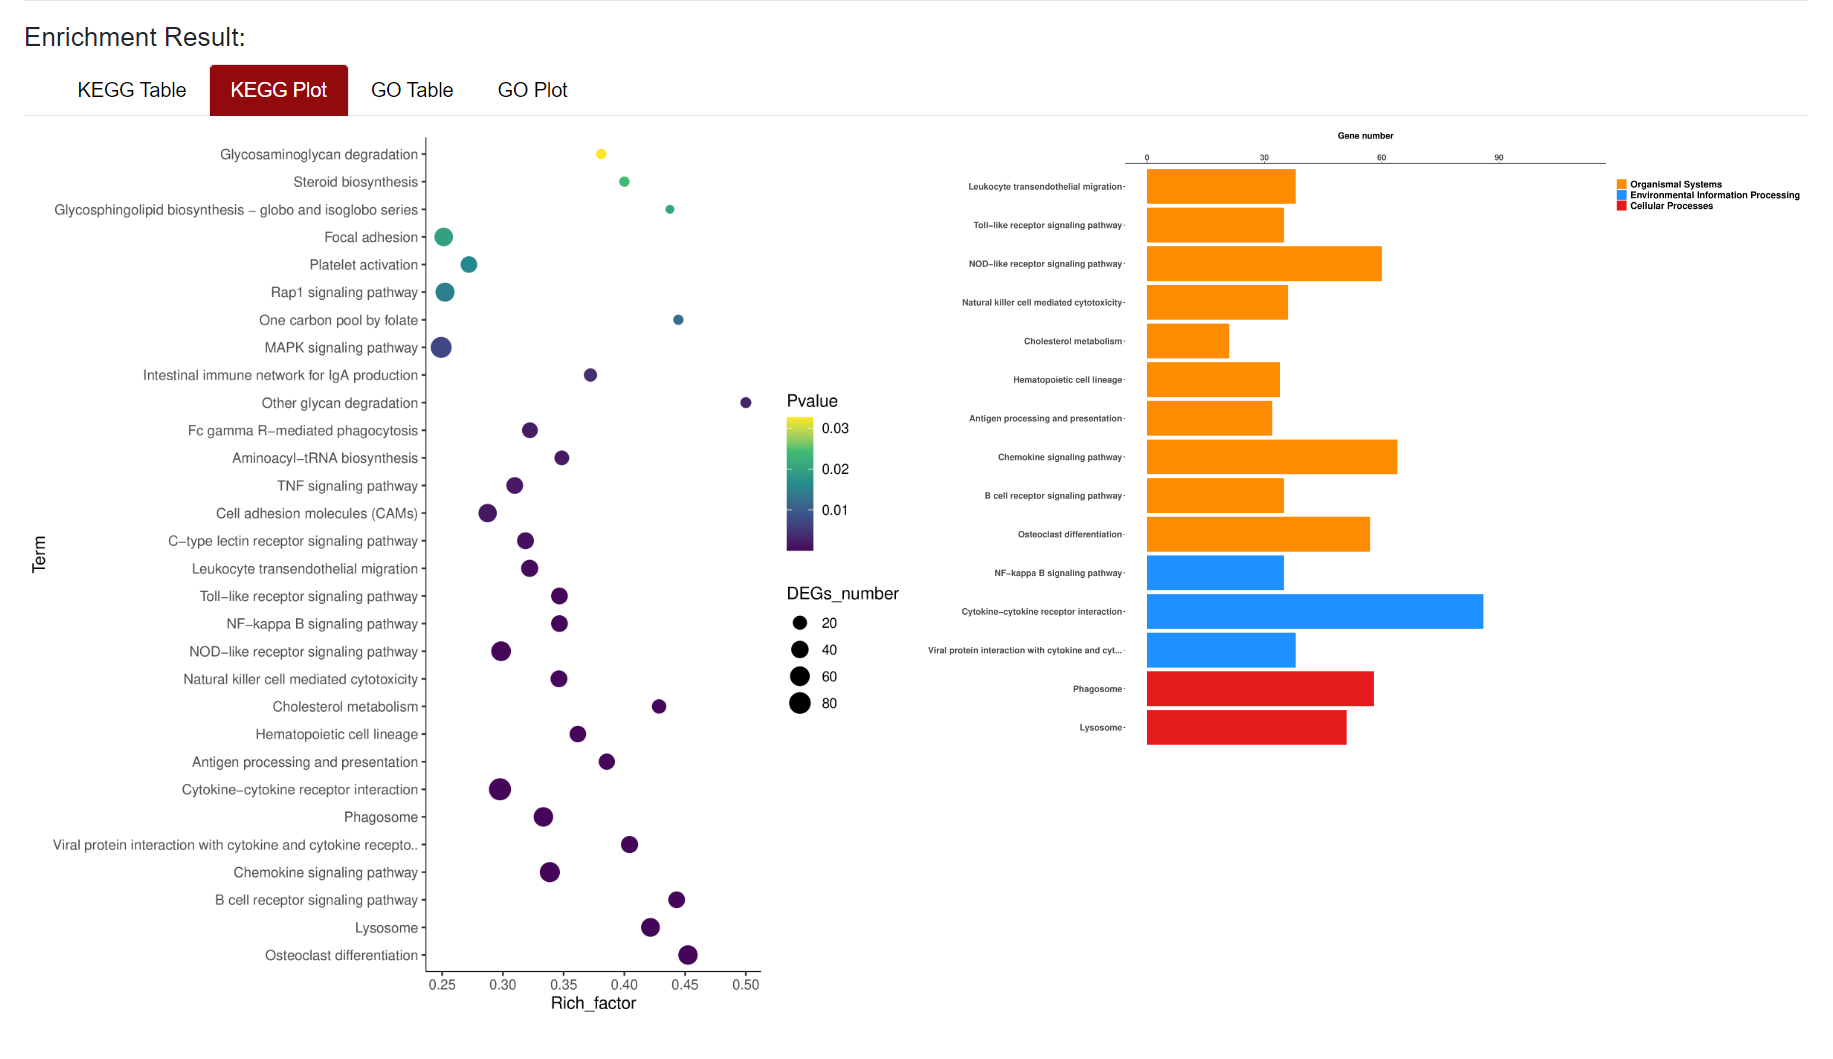
An "Enrichment" button, located next to the search bar at the top left of the table, enables enrichment analysis of differentially expressed genes, including KEGG and GO analysis. The results of the analysis are shown in Table and Plot, the first three columns of KEGG Table are the three levels of KEGG classification, and the "ID" corresponds to the KO identifier enriched in the KEGG database. "Input number" represents the number of differentially expressed genes annotated to KEGG metabolic pathway or functional category. Similarly, "Background number" represents the number of genes annotated to KEGG metabolic pathway or functional category in the list of all detected genes. KEGG Plot is a graphical representation of the results of KEGG enrichment analysis.
Result Presentation
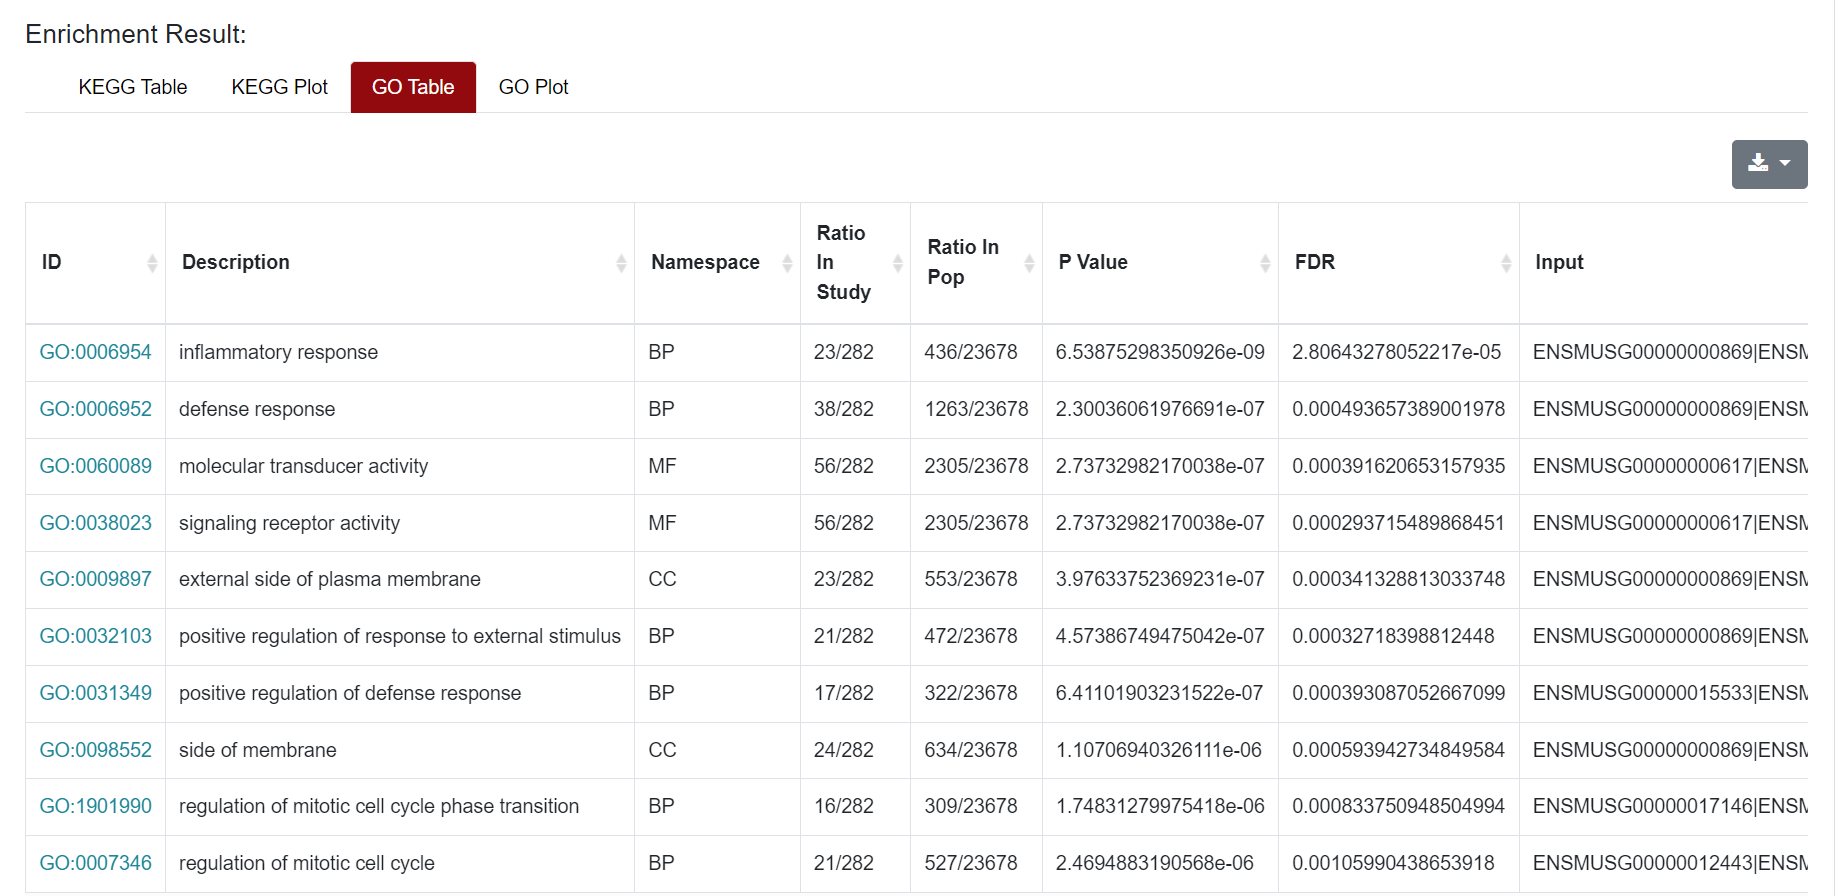
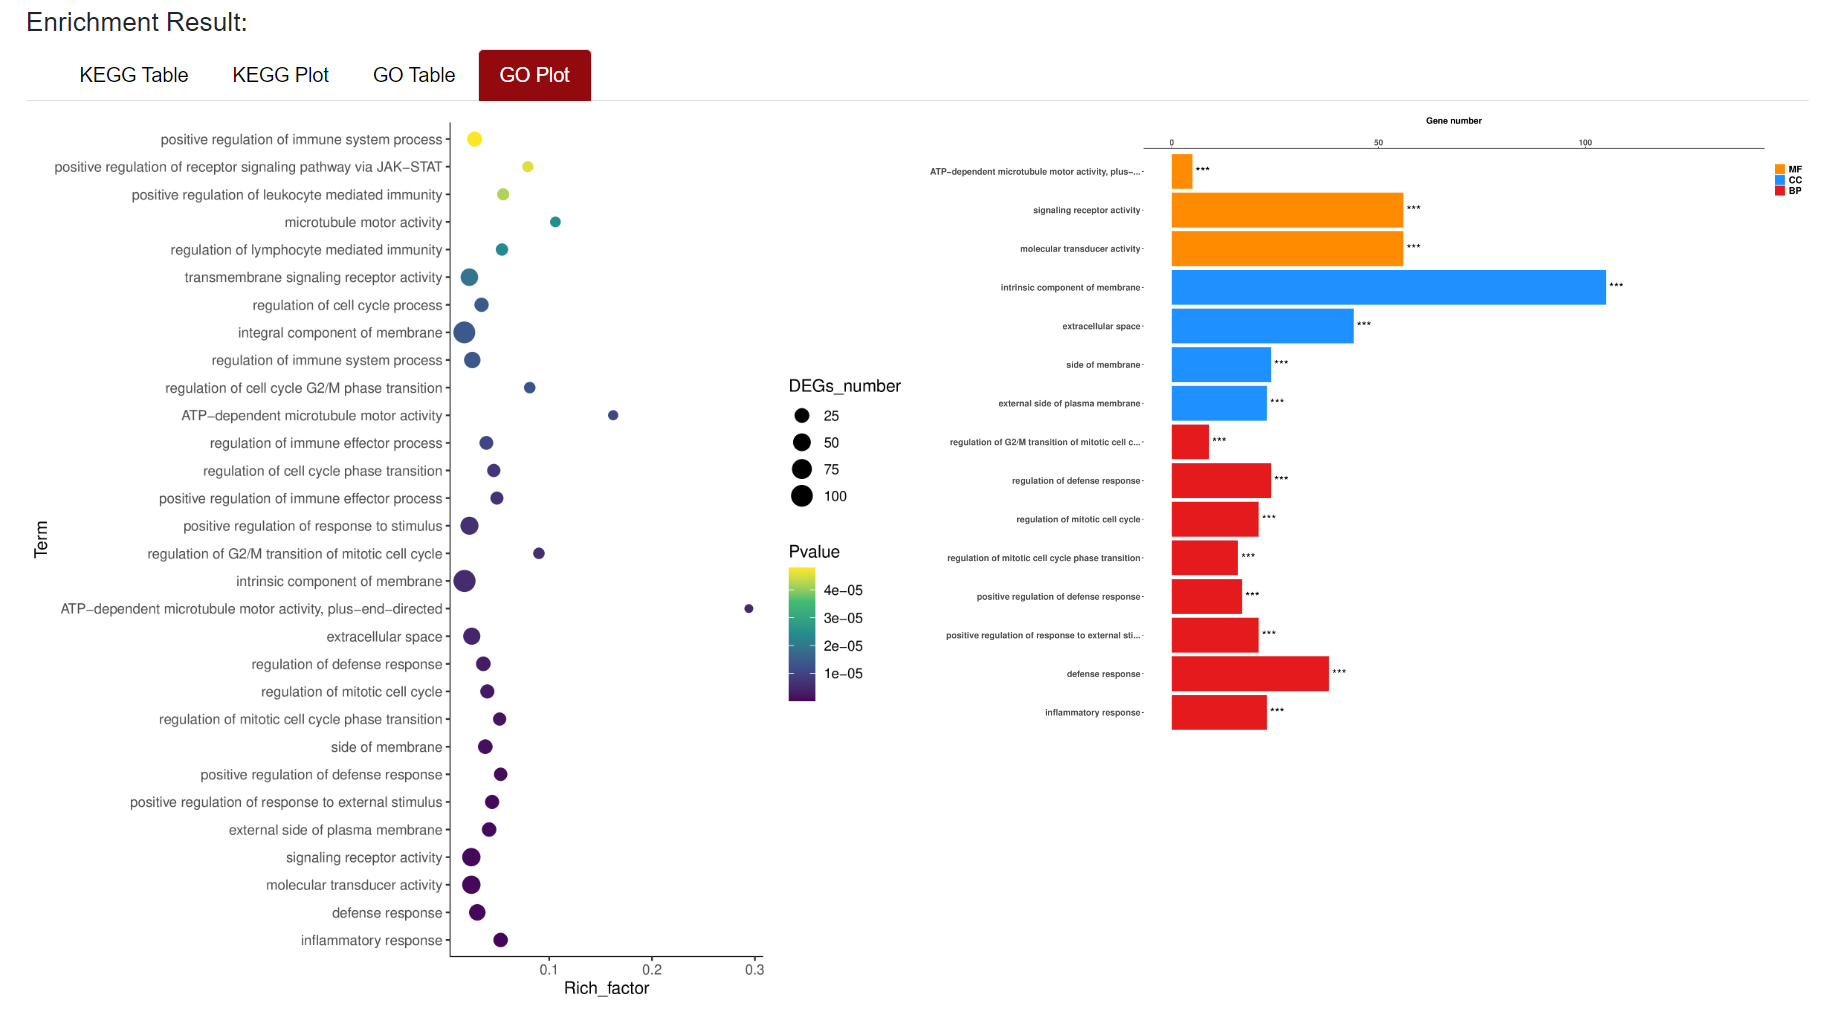
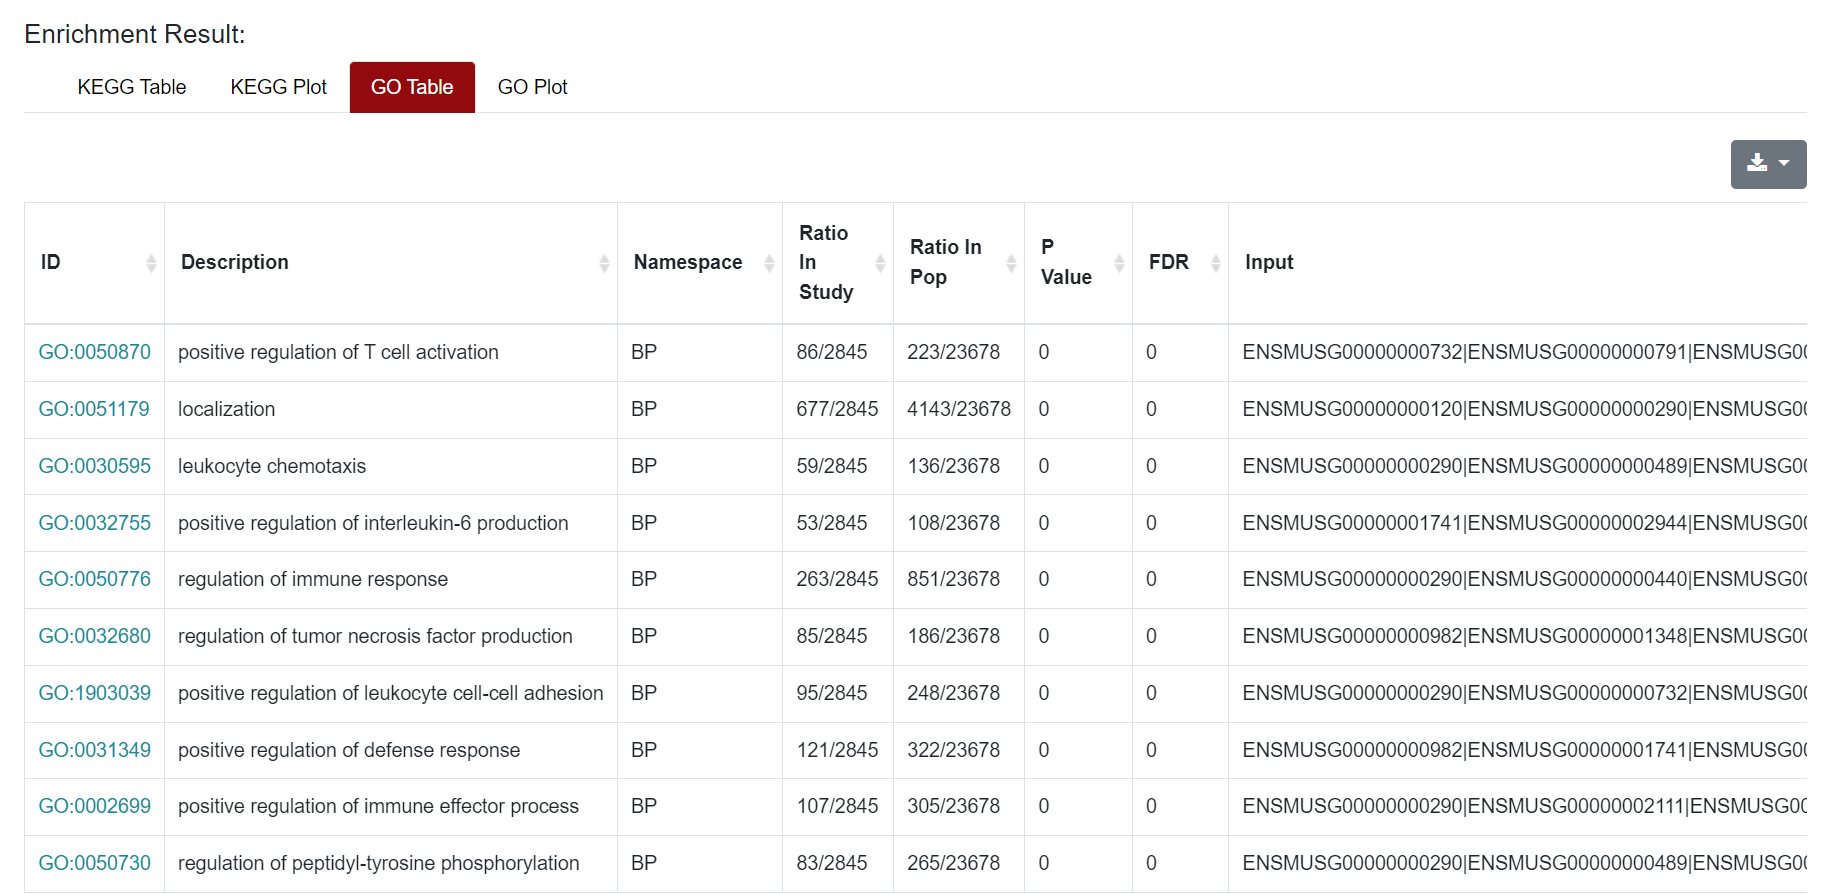
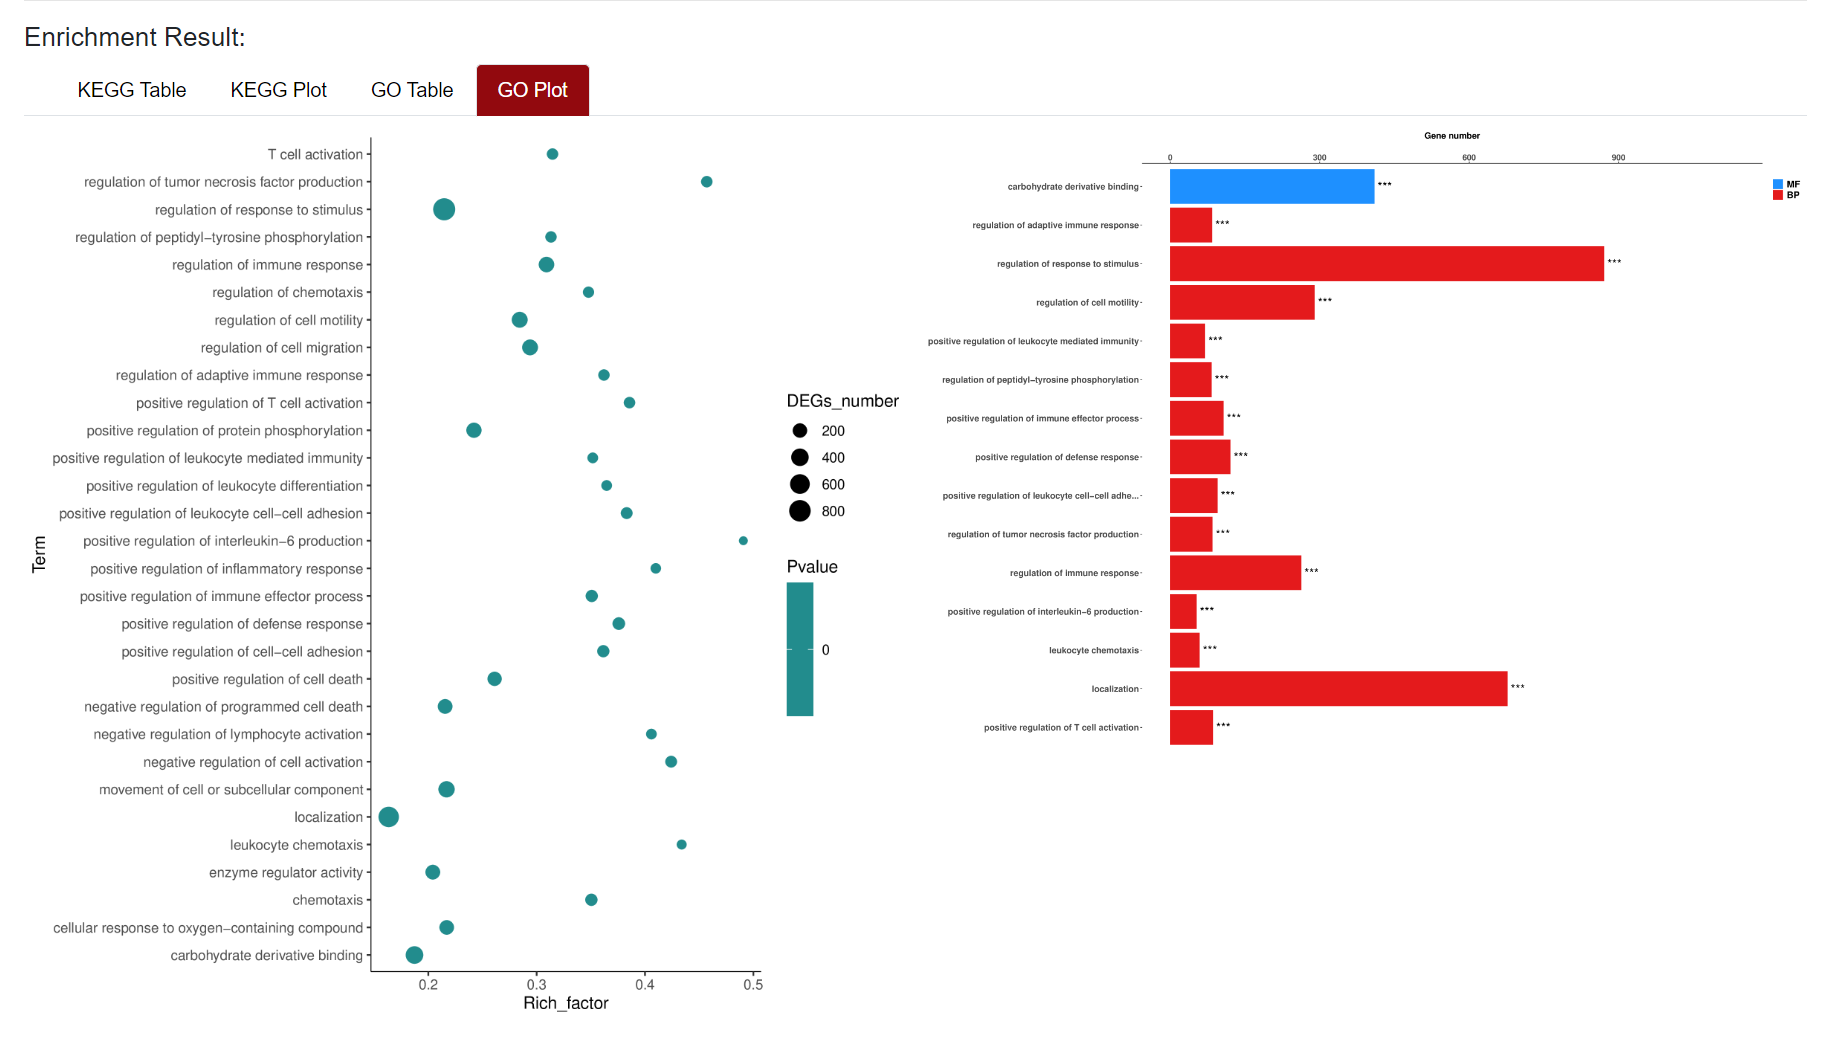
Similarly, the results of GO enrichment analysis were also presented in Table and Plot. In the Table section, the "ID" column represents the enriched GO ID, the "Description" column contains the description of the pathway, and the "Namespace The "ID" column represents the classification of GO analysis, including Biological Process (BP), Cellular Component (CC) and Molecular Function (MF). "Ratio in study" represents the ratio of the number of differentially expressed genes annotated to this GO term to the total number of genes in the prospective dataset; "Ratio in pop" represents the ratio of the number of genes annotated to the GO term to the total number of genes in the background dataset for the whole genome. At the top right of the table of results, users can download the results of the enrichment analysis. For the figure, users can click on the figure and download it.
2. RNA-seq Section
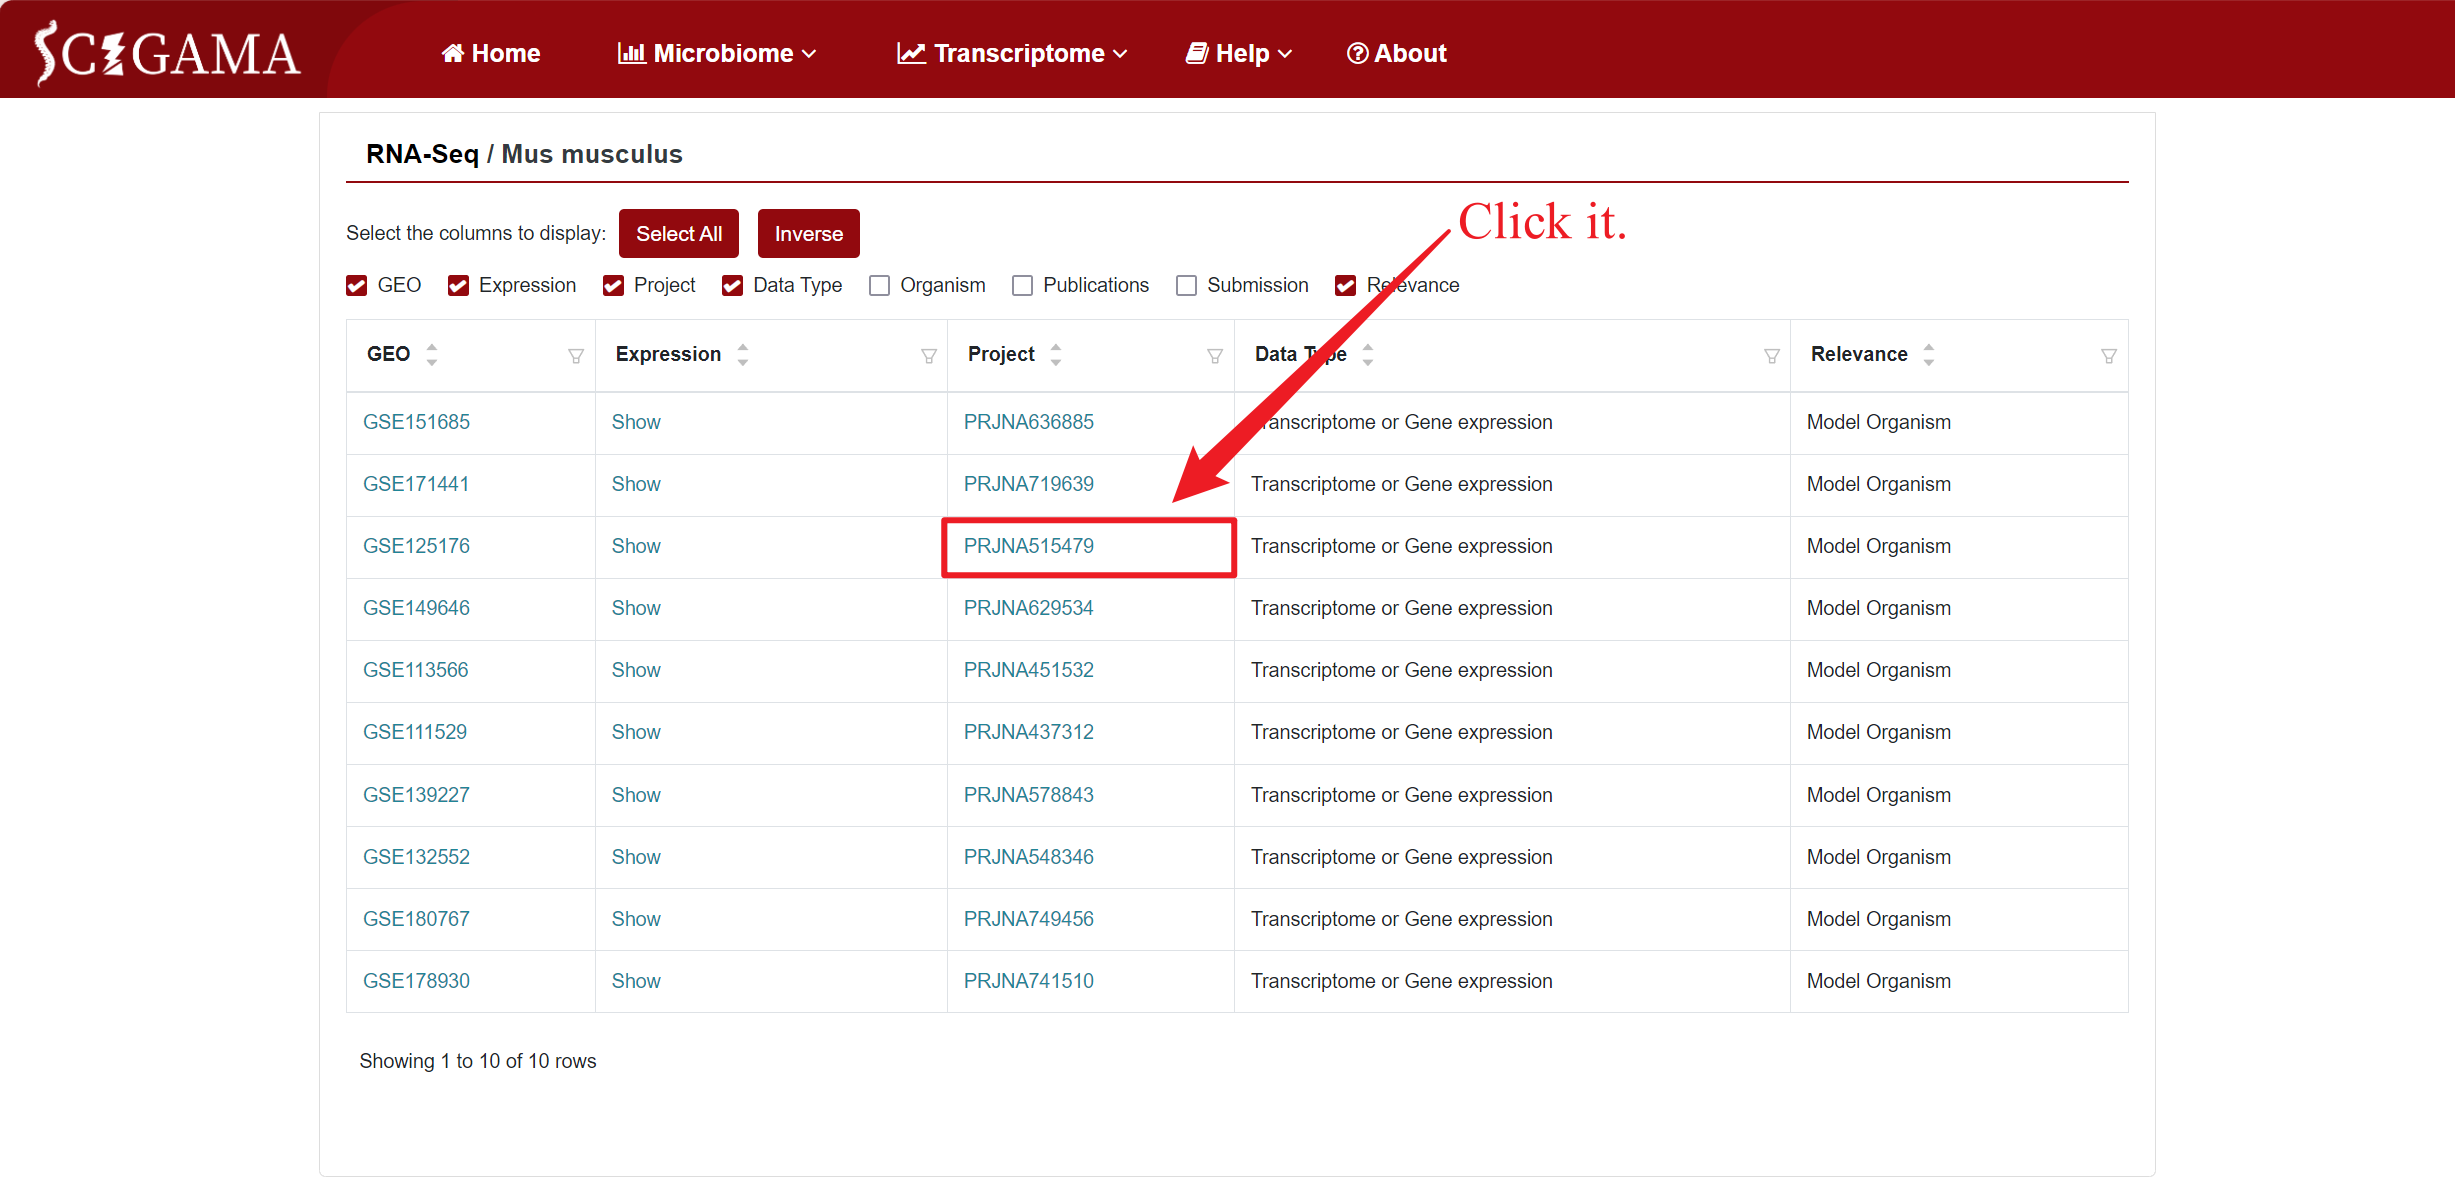
For the purpose of this tutorial, we will focus on the Mus musculus data as an illustrative example. Hover the mouse over “Transcriptome” in the home page navigation bar, then select ‘RNA-seq’ in the submenu under “Public Datasets”, and then select “Mus musculus”. After that, SCIGAMA will go to a new page where users can select the datasets they are interested in viewing.
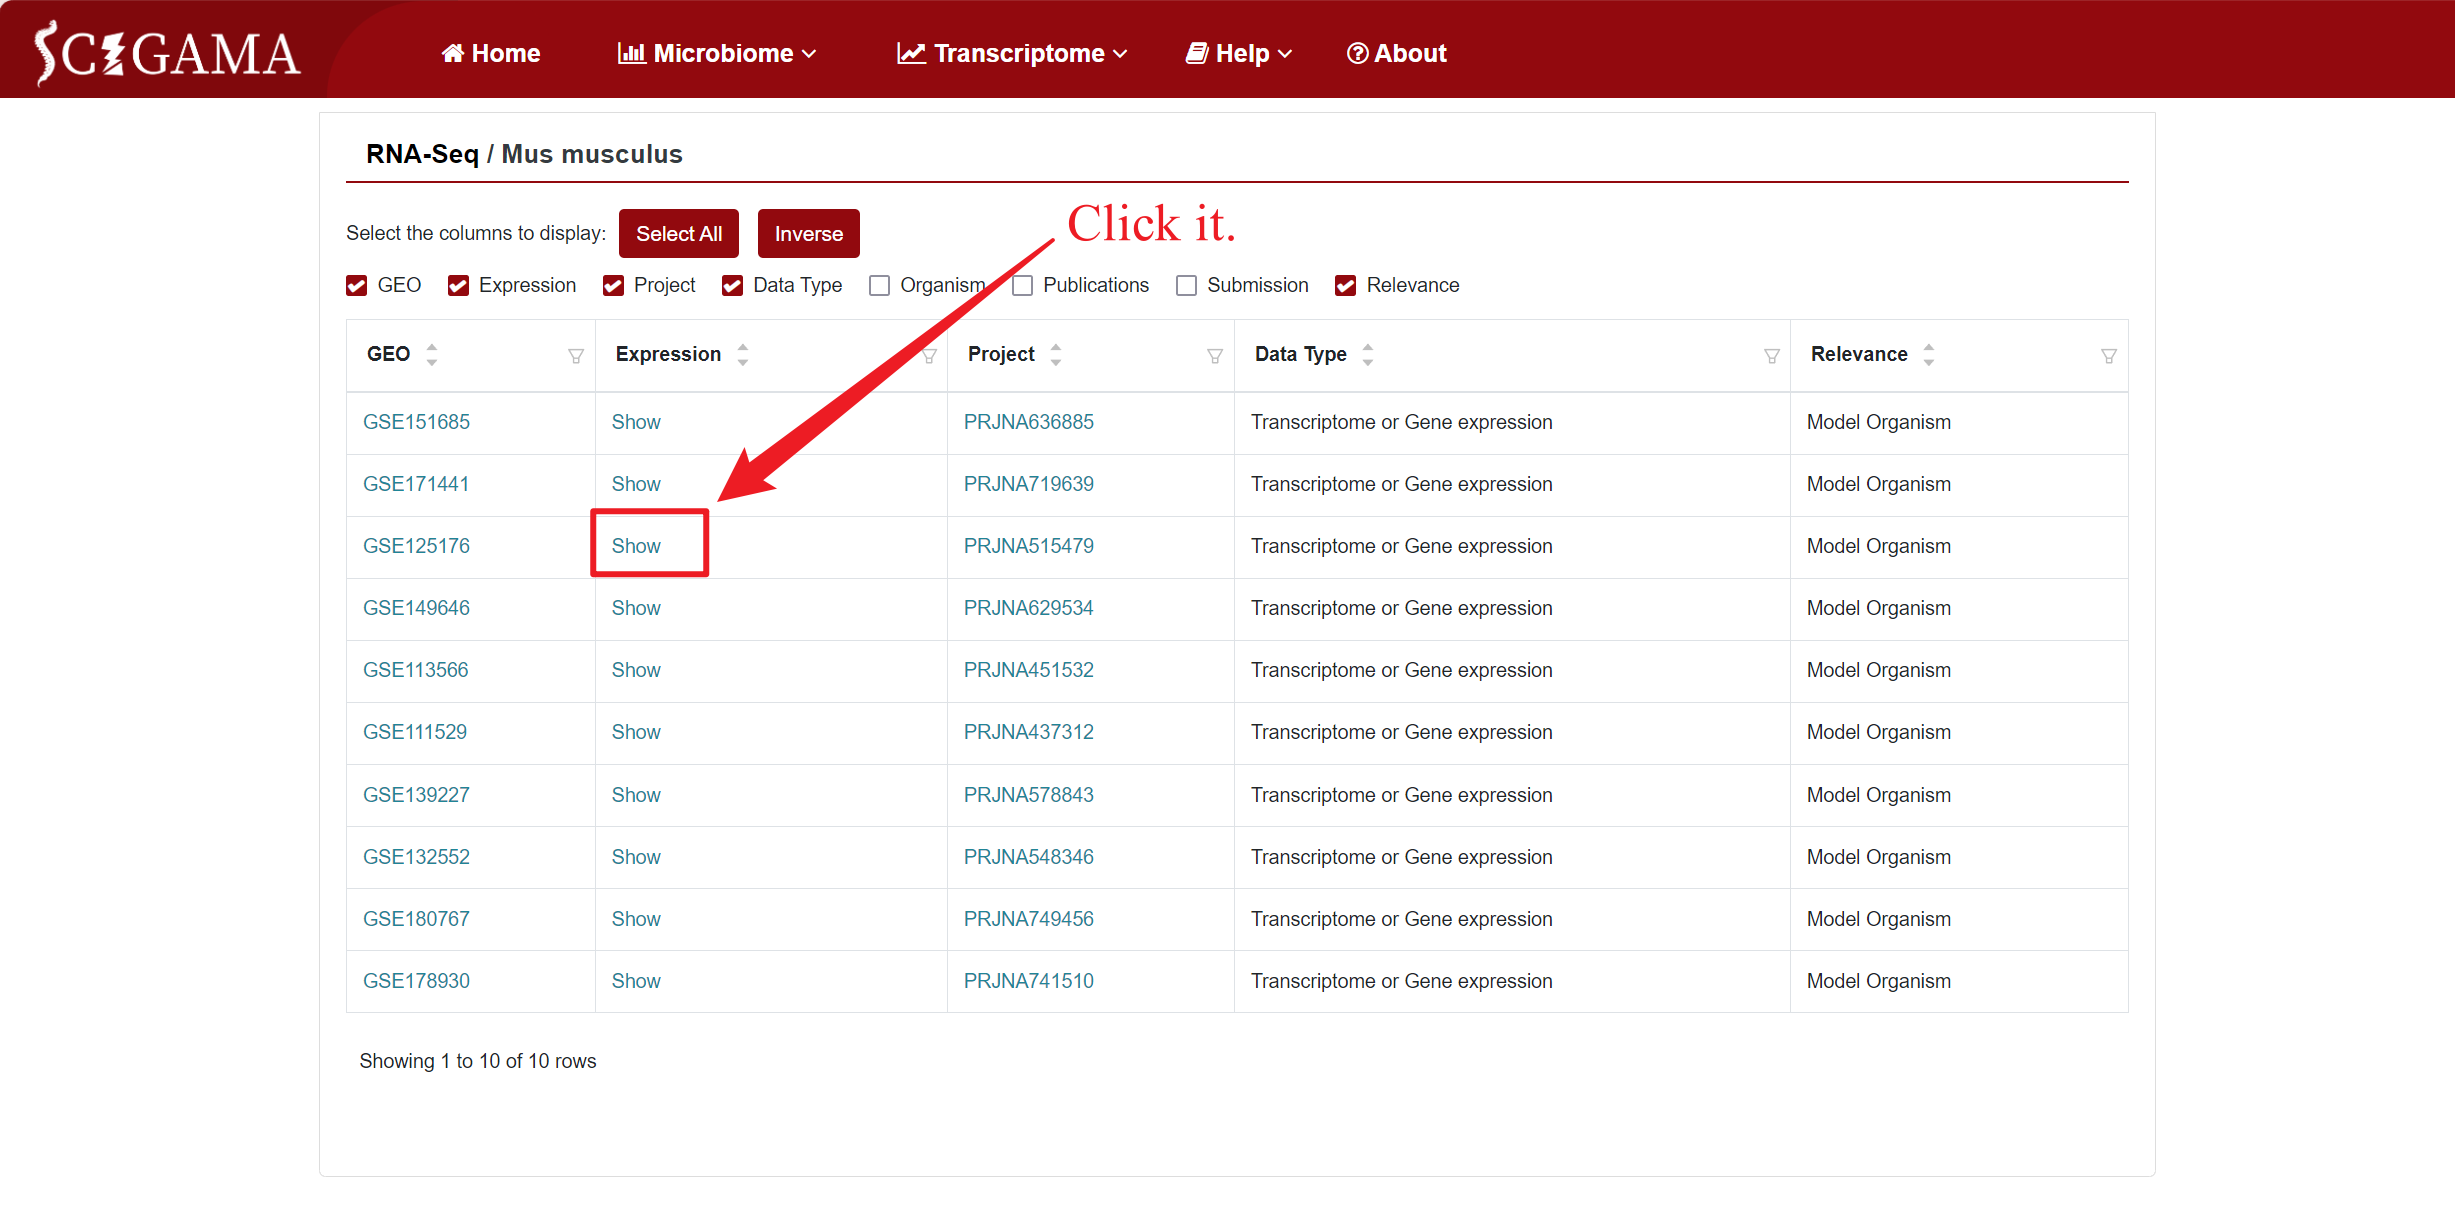
According to the current accessible public RNA-seq data on SCI species, the RNA-seq Section comprises three subpages: Ambystoma mexicanum, Danio rerio, Mus musculus, and Rattus norvegicus. When clicking on Mus musculus, SCIGAMA will jump to the corresponding subpage. Here, columns of information can be selectively displayed by ticking the selection criteria. If no changes are made, all information columns are checked by default. We recommend that users keep at least the GEO, Expression and Project columns.
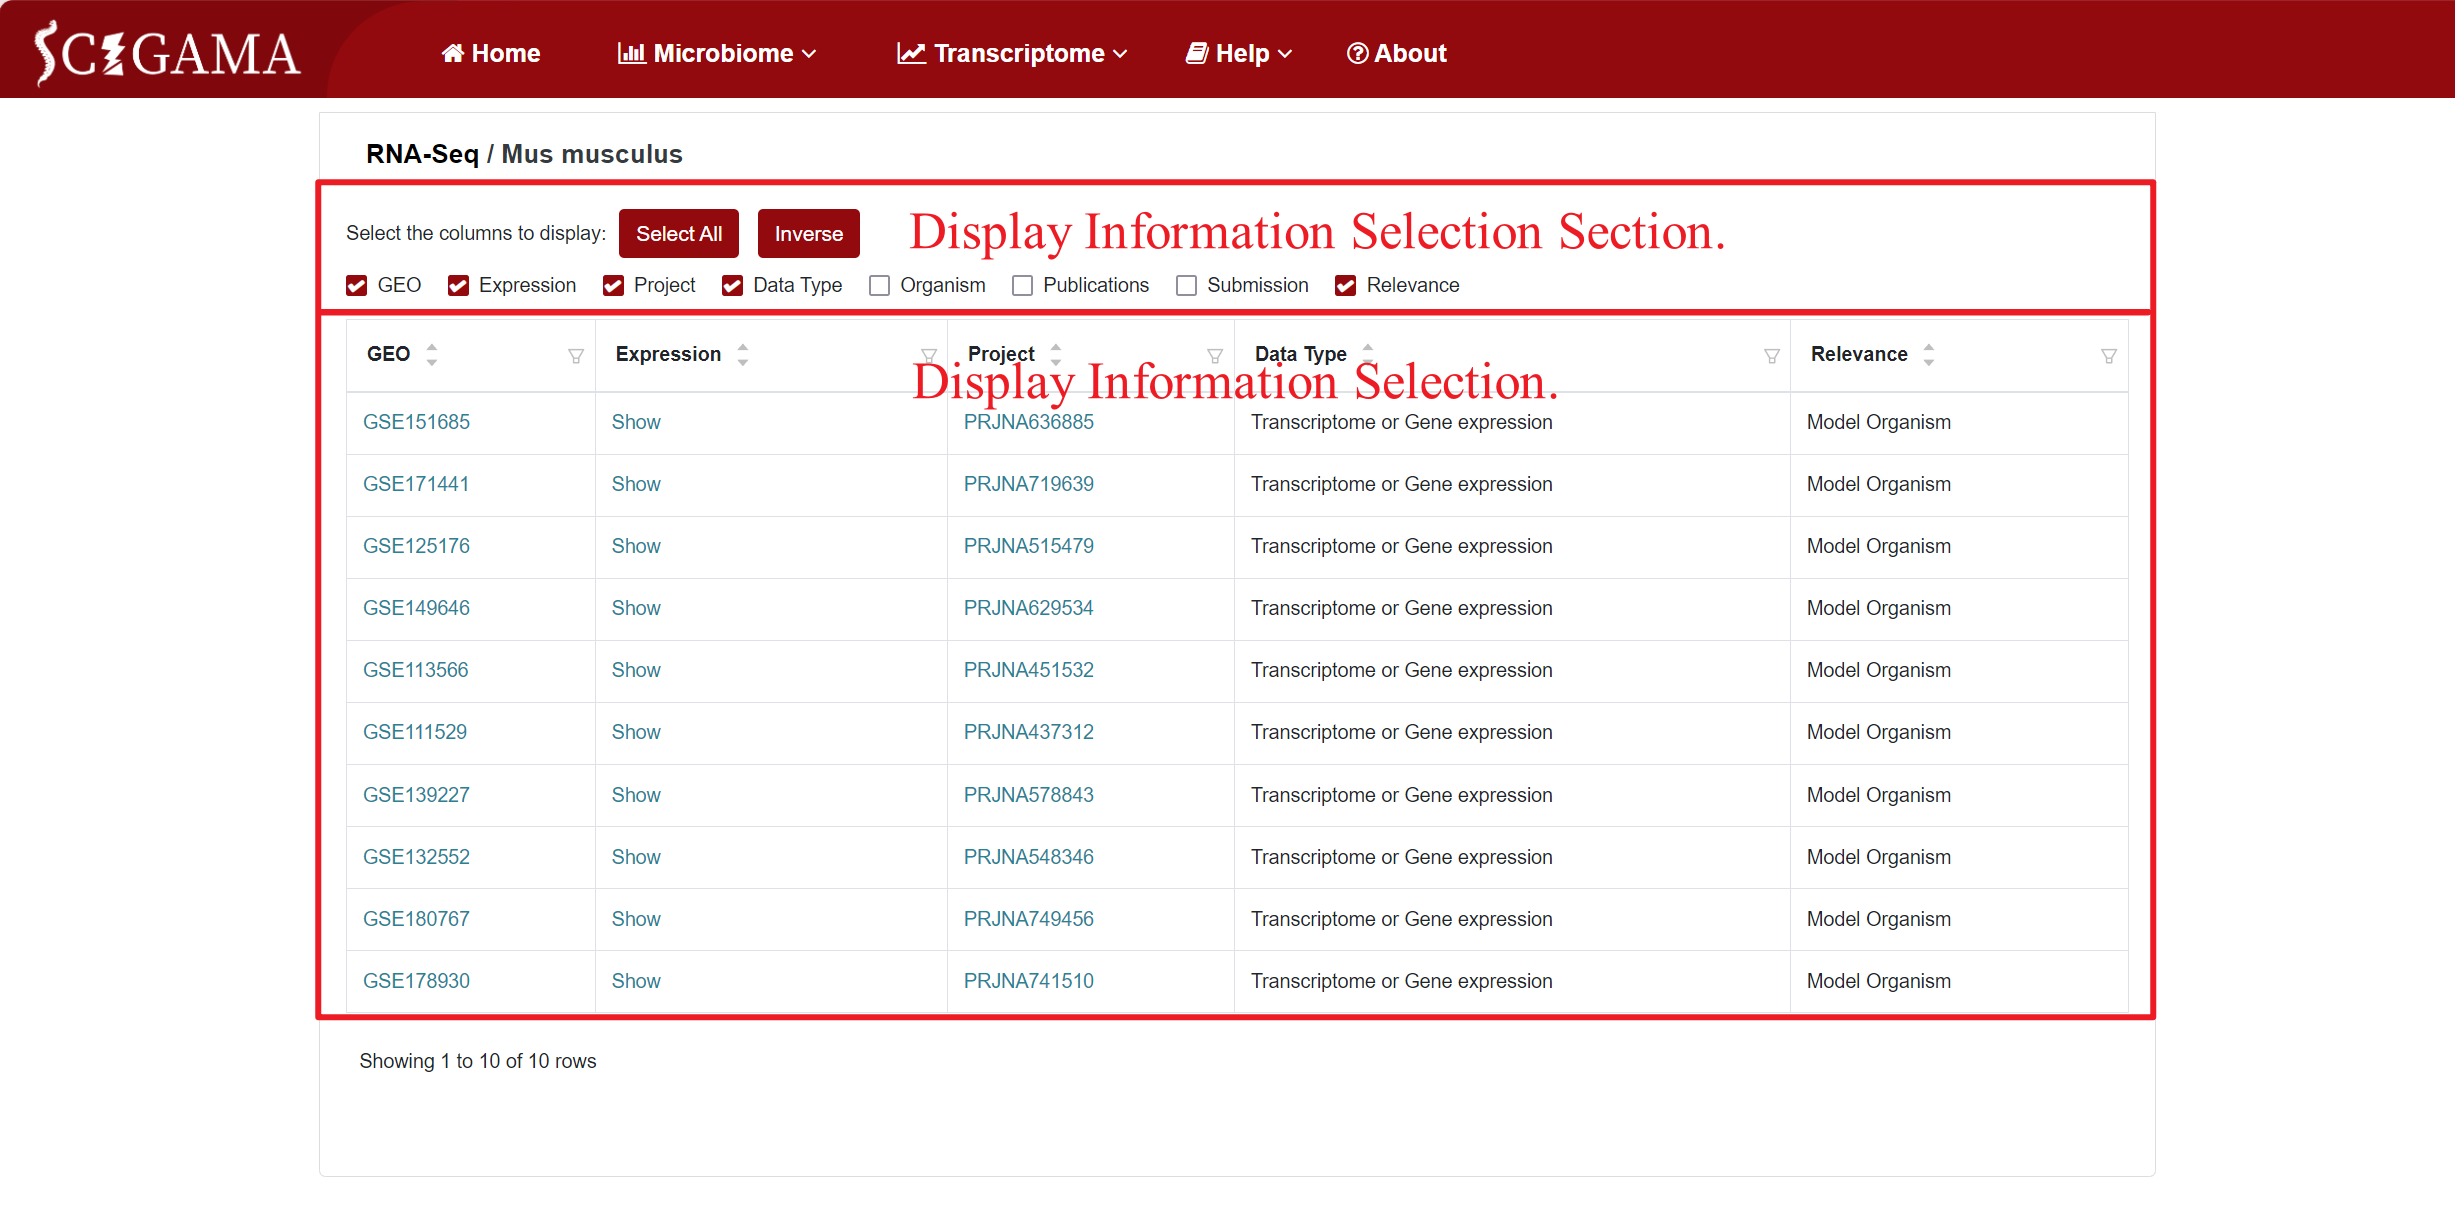
Columns and their descriptions in the results table.
| Column | Description of the column |
|---|---|
| GEO | Record the GEO Series ID, identifying the public data source. |
| Expression | Click on this column allows users to view differentially expressed genes based on their selection of displaying information. |
| Project | Display the BioProject to which the public data belongs. |
| Organism | Provide information on the model animal species. |
| Data Type | Indicate the type of RNA detected in the public data. |
| Publications | List the original published articles that utilized this data. |
| Submission | Detail the submission information for this public data. |
| Relevance | Confirm whether the data originates from a Model Organism source. |
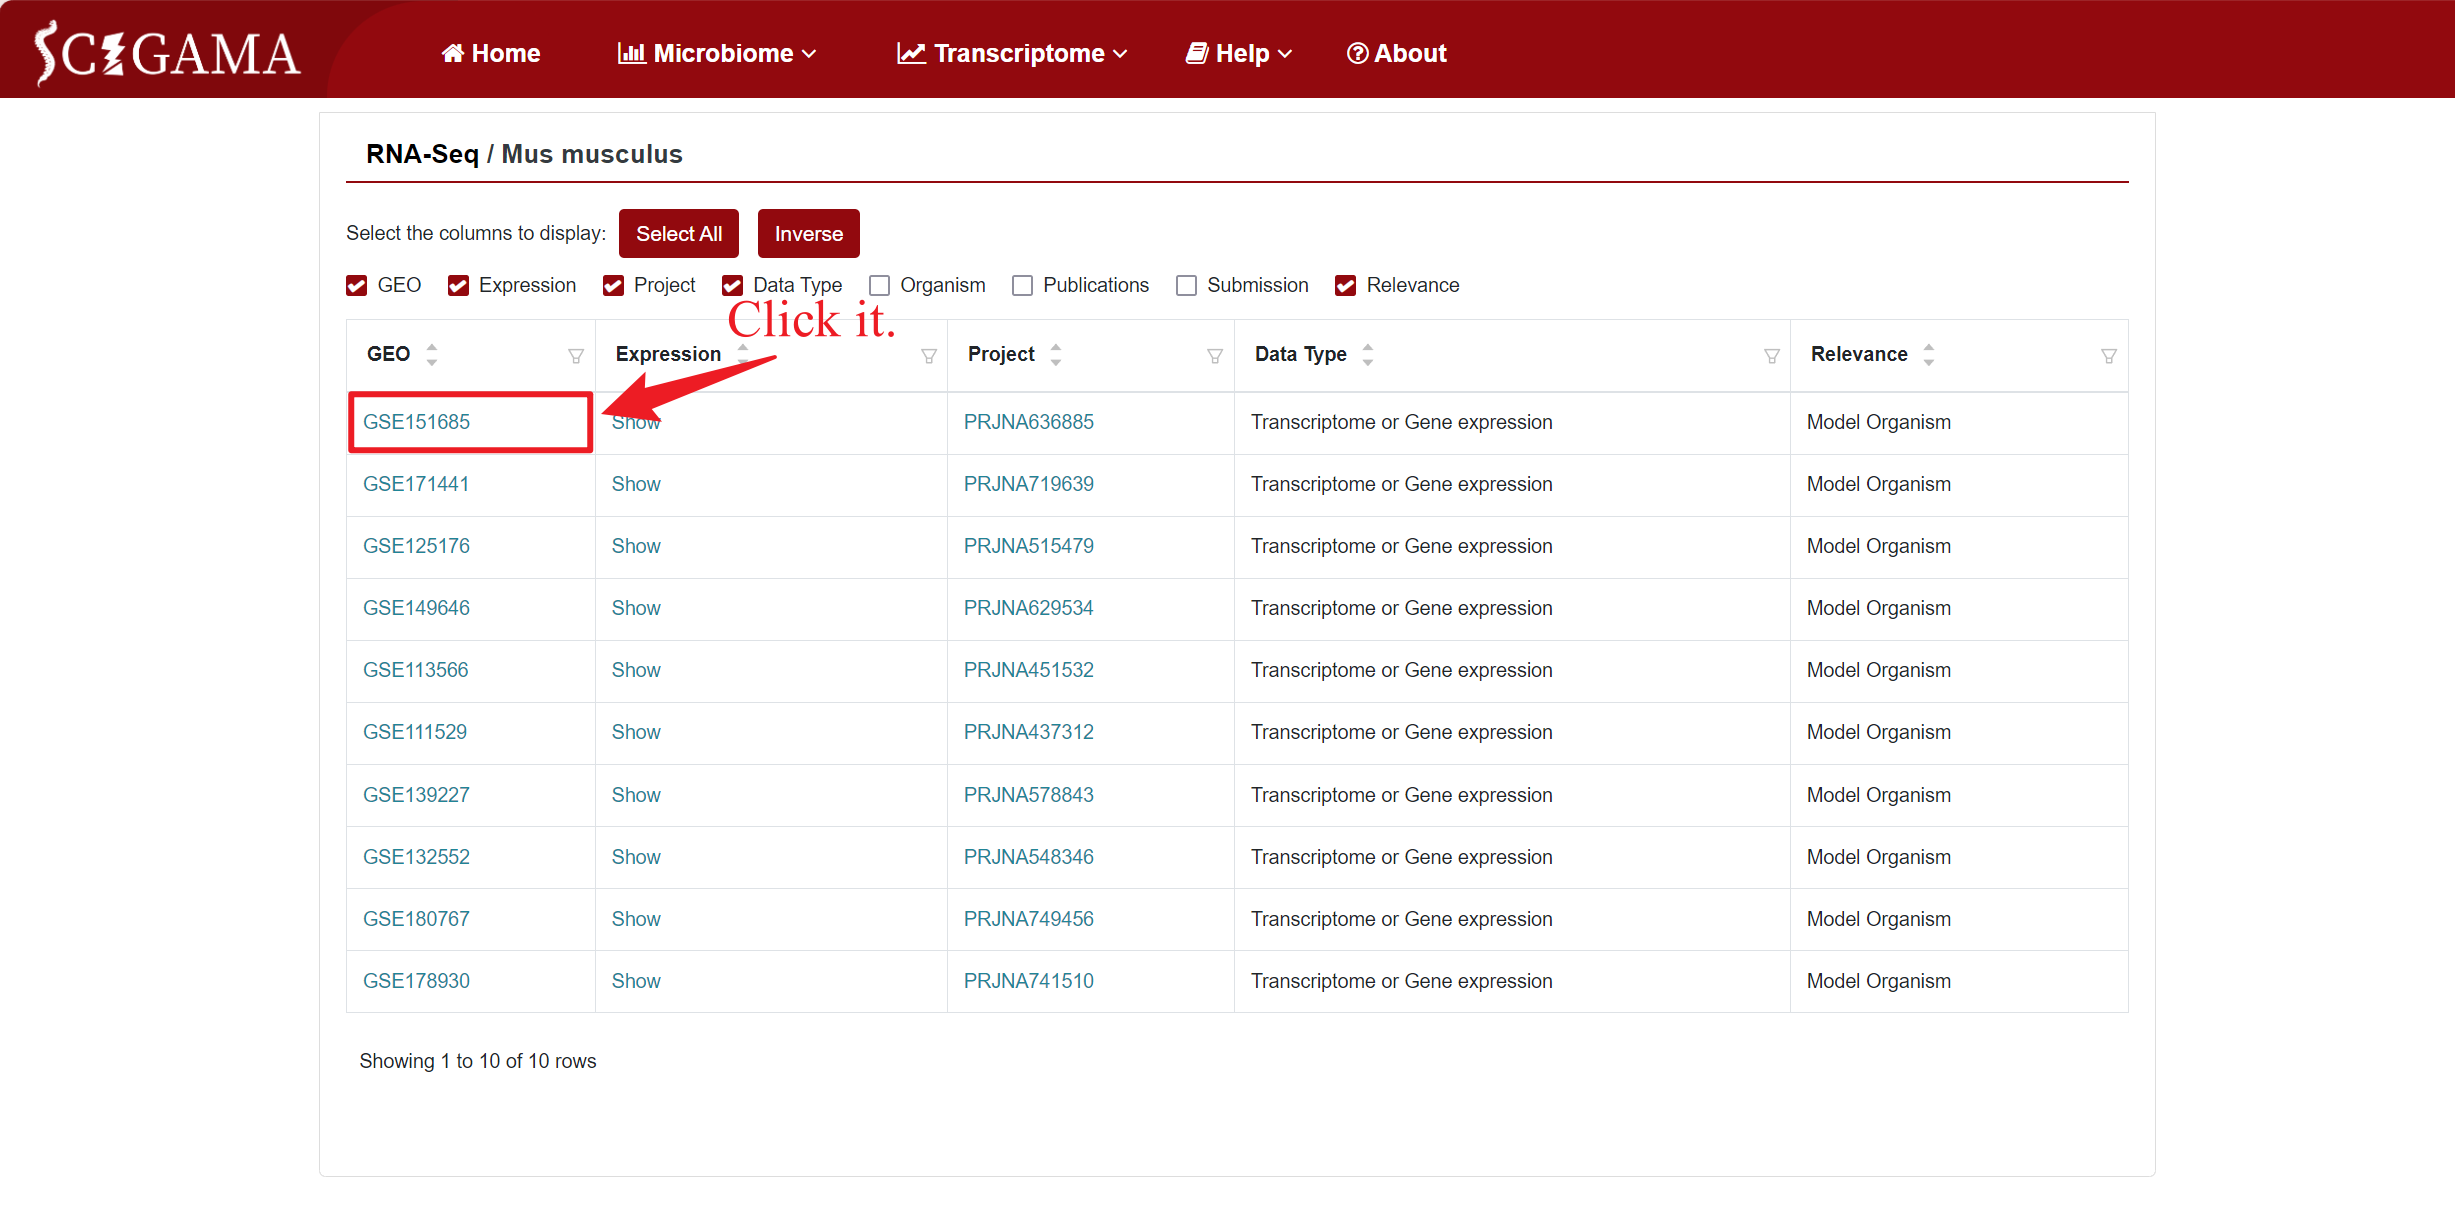
2.1 GEO
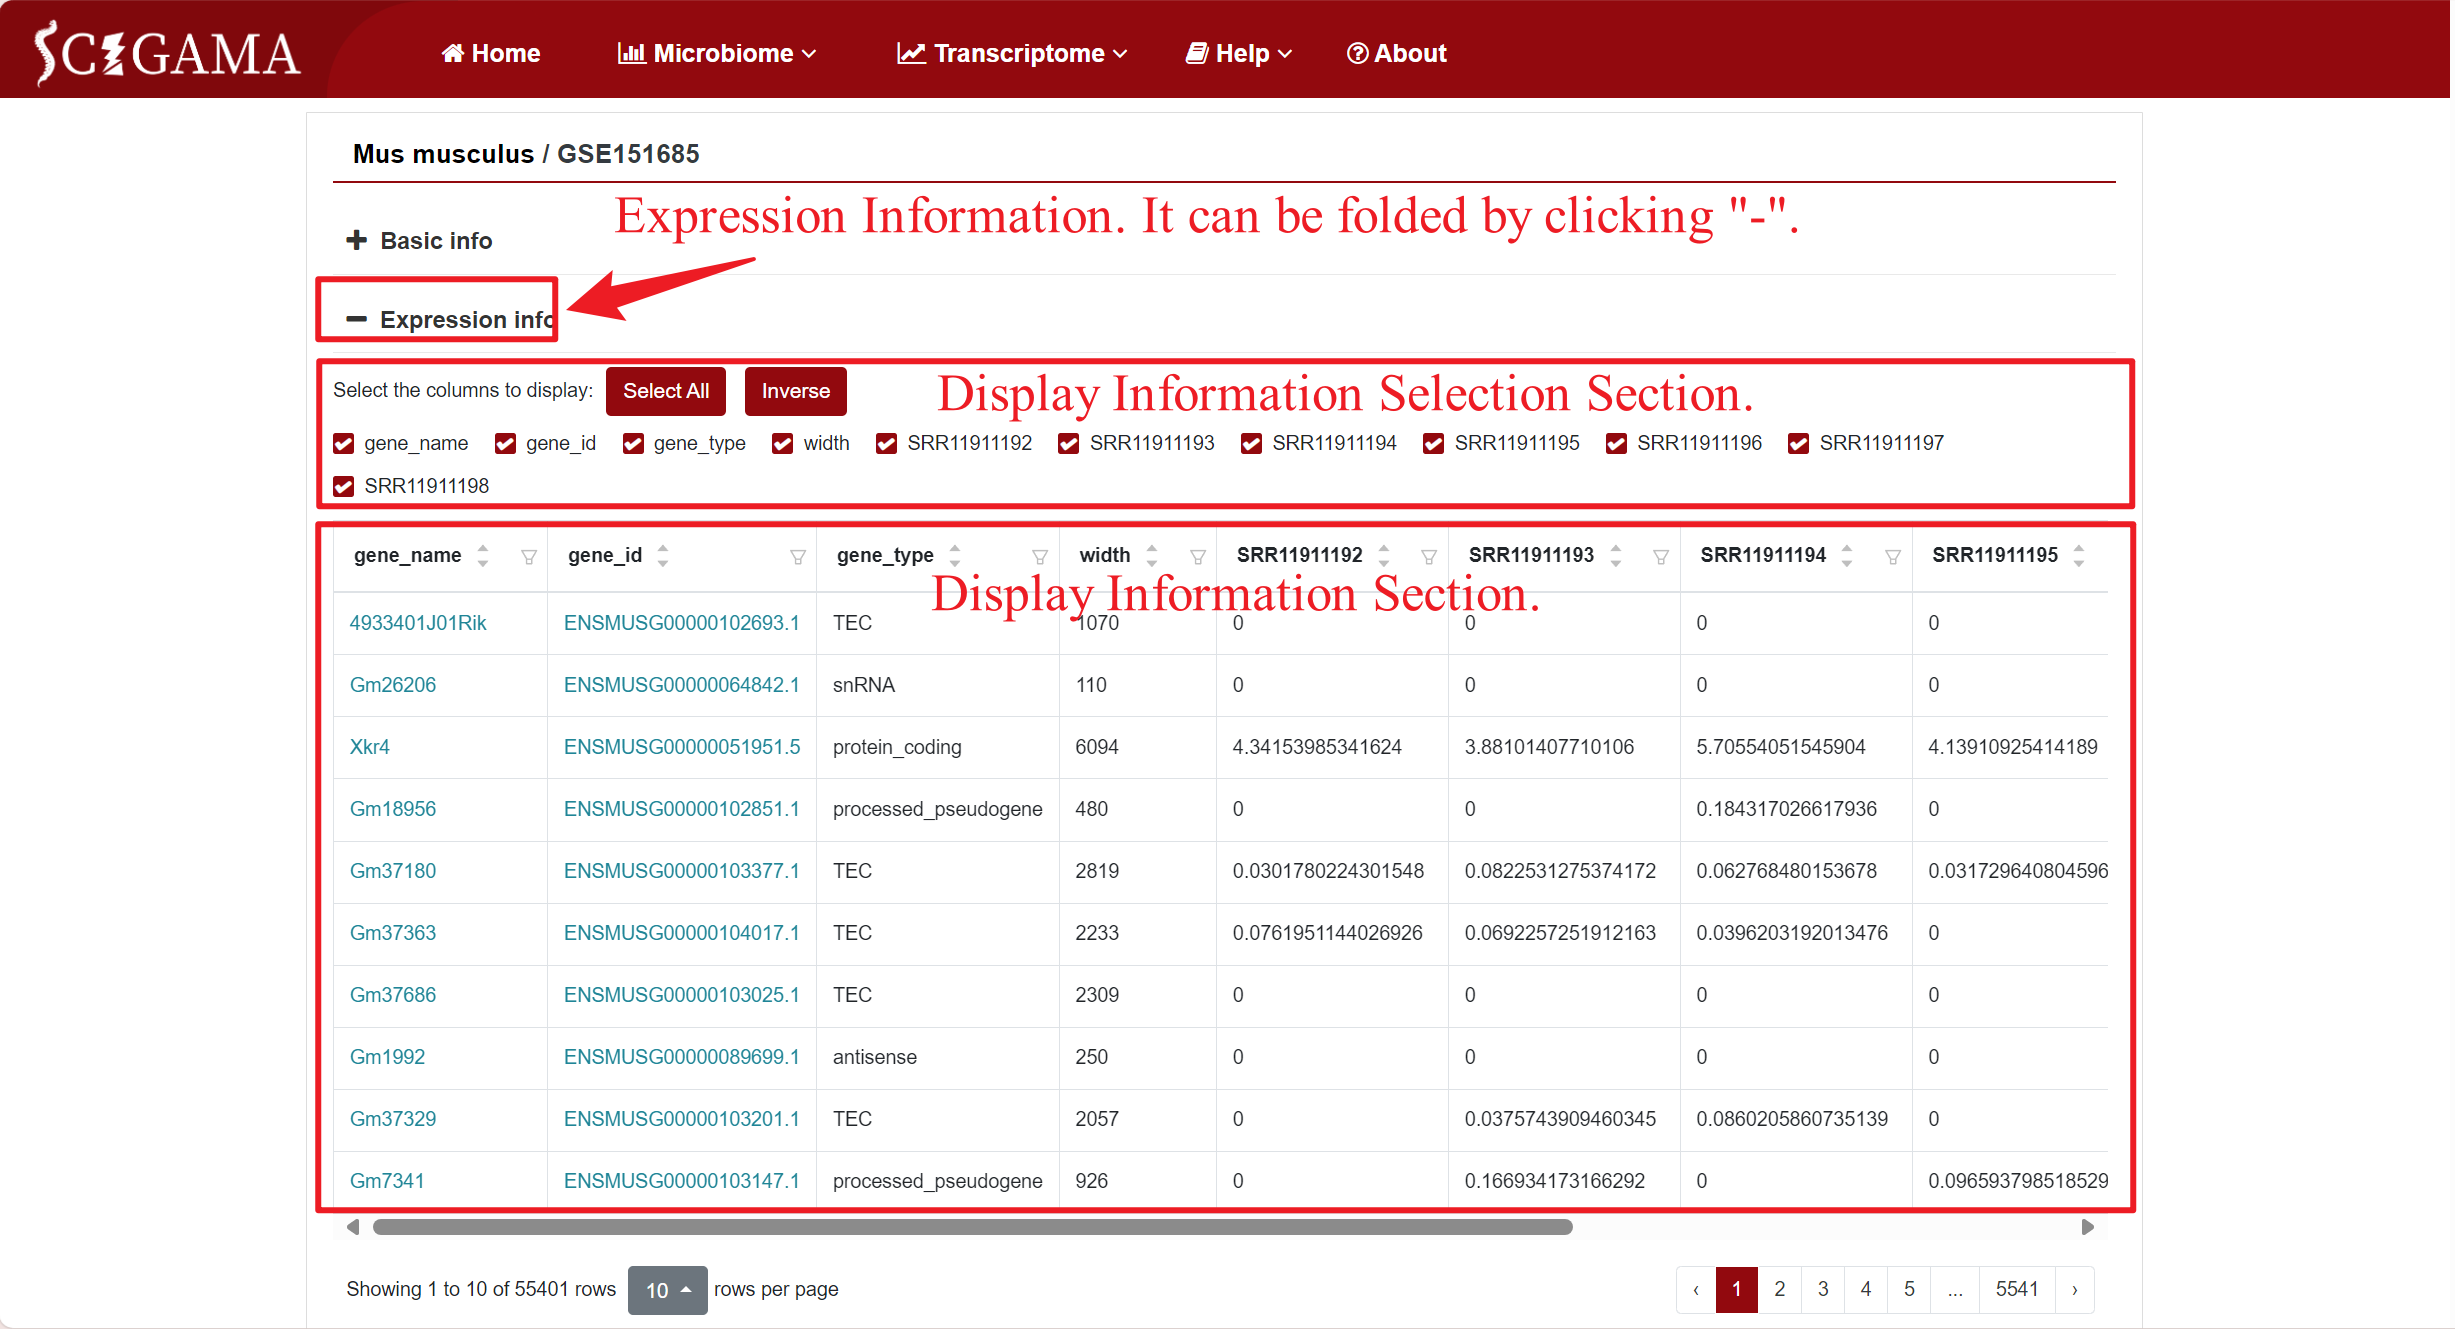
By clicking on the GSE number in the "GEO" column of the table, SCIGAMA redirects to a page containing comprehensive basic information about the public data for that specific GSE number, including sample details, all of which can be collapsed from the GEO database. In addition, clicking on the "Mus musculus" section will redirect the user to the previous page.
Users have the option to customize the display of expresision information based on their requirements. Apart from individual samples, we suggest retaining at least the "gene_name" and "gene_type" columns for reference. Clicking on the "gene_name" or "gene_type" columns will redirect the page to the corresponding websites.
2.2 Expression
2.2.1 Selection of RNA-seq
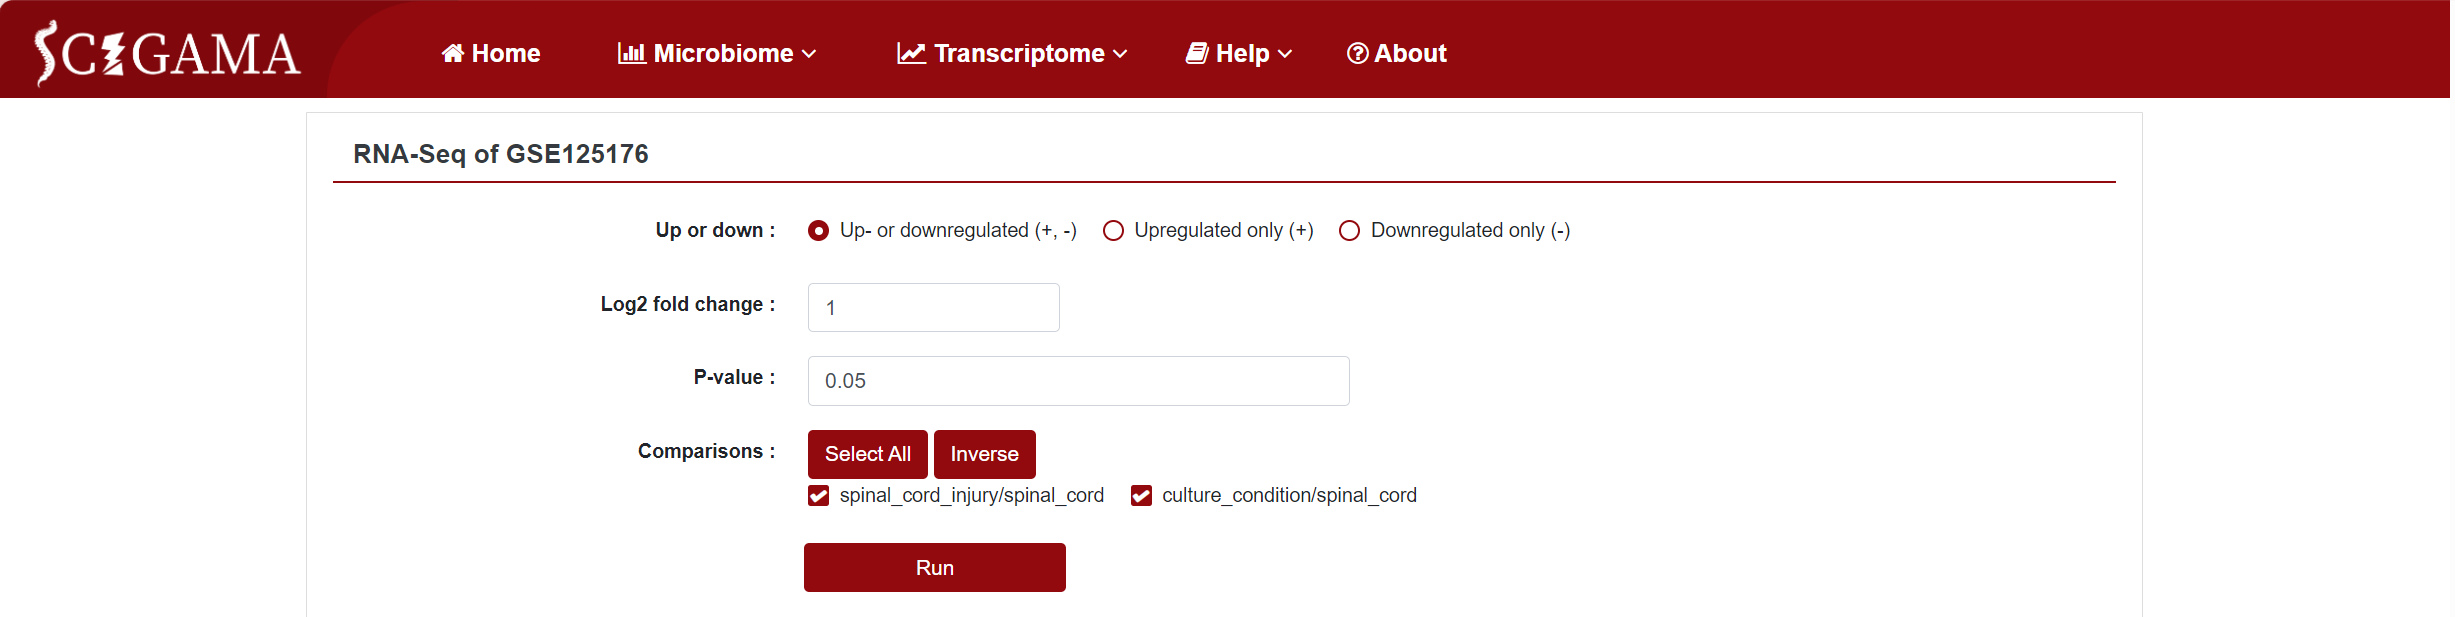
Similar to the Microarray section, the Expression column offers a "Show" option, allowing users to view the expression differences in a specific dataset. Clicking on "Show" will take users to a new page where they can further filter the data they wish to see. We offer the options Up- or downregulated (+, -), Upregulated only (+) and Downregulated only (-), and we also support the personalisation of the Log2 Fold Change absolute value and P-value, which defaults to 1 and 0.05 respectively. Finally, users can also change the displayed comparison results by setting the "Comparison" to the comparison group they want to get. After setting the above options, click "Run" to get the results that users want.
2.2.2 Results of RNA-seq
For the visualization of differentially expressed genes, SCIGAMA have adopted the heatmap approach. At the top left of the result figure, there is a Search box for you to find the genes you want to focus on in the result. The Plot column contains the expression status of each gene, and here we use a box line graph to show the expression status of the gene in different groups. id stands for the name of the gene. In different "Comparison" columns, the name of the column implies the comparative information of the groups; the color represents the differential expression of the gene, red means up-regulation, blue means down-regulation. The color of each gene represents the differential expression of the gene, red means up-regulation, blue means down-regulation. The shade of the color represents the size of the Log2 Fold Change, the larger the absolute value, the darker the color. When the mouse hovers over the color block of the corresponding gene in the "Comparison" column, the specific Log2 Fold Change and P-value of the gene will be displayed.
An "Enrichment" button, located next to the search bar at the top left of the table, enables enrichment analysis of differentially expressed genes, including KEGG and GO analysis. The results of the analysis are shown in Table and Plot, the first three columns of KEGG Table are the three levels of KEGG classification, and the "ID" corresponds to the KO identifier enriched in the KEGG database. "Input number" represents the number of differentially expressed genes annotated to KEGG metabolic pathway or functional category. Similarly, "Background number" represents the number of genes annotated to KEGG metabolic pathway or functional category in the list of all detected genes. KEGG Plot is a graphical representation of the results of KEGG enrichment analysis.
Result Presentation
Similarly, the results of GO enrichment analysis were also presented in Table and Plot. In the Table section, the "ID" column represents the enriched GO ID, the "Description" column contains the description of the pathway, and the "Namespace The "ID" column represents the classification of GO analysis, including Biological Process (BP), Cellular Component (CC) and Molecular Function (MF). "Ratio in study" represents the ratio of the number of differentially expressed genes annotated to this GO term to the total number of genes in the prospective dataset; "Ratio in pop" represents the ratio of the number of genes annotated to the GO term to the total number of genes in the background dataset for the whole genome. The demonstration of the table and figure download can be found in the Microarray section.
2.3 Project
Users can click on the "Project" section to navigate to corresponding "BioProject" page of NCBI.