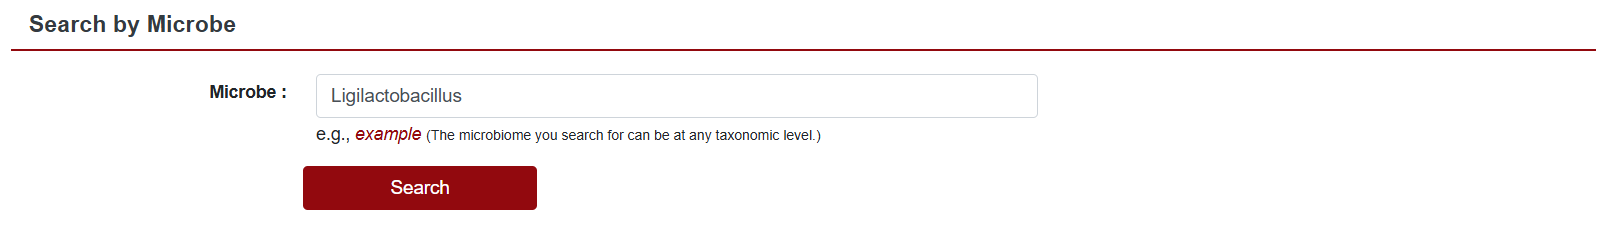
Search Interface
After clicking “Search by Microbe” SCIGAMA will redirect you to the “Search by Microbe” subpage. On this page, users can enter a microbe to search for. SCIGAMA provides the example “Ligilactobacillus” After clicking “Search” SCIGAMA will display the results at the bottom of the page.
Results Interface
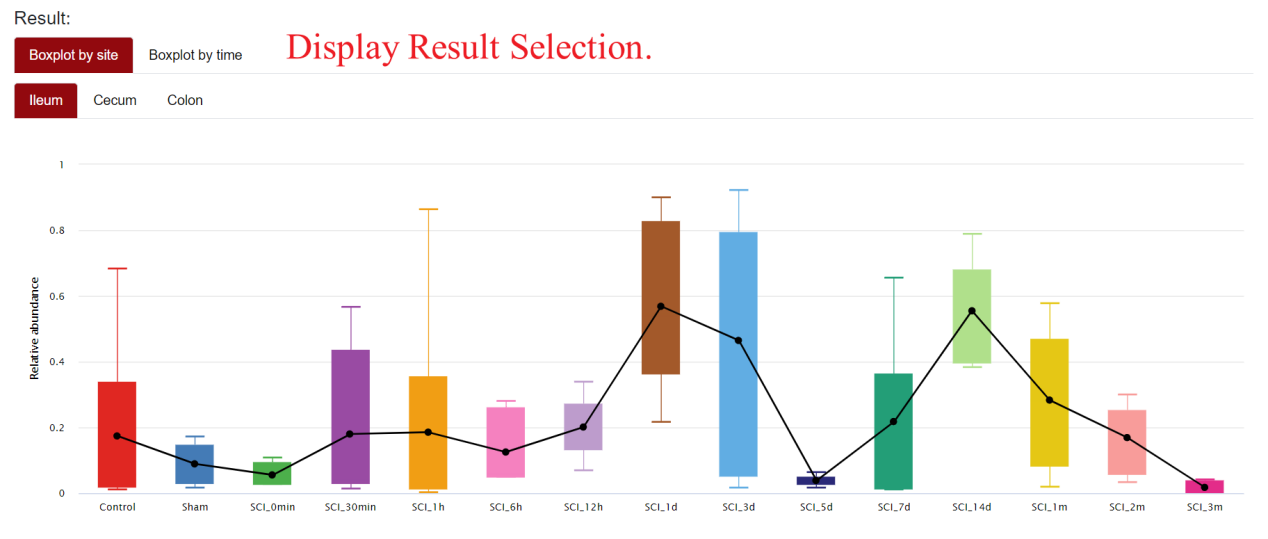
Microbial Abundance Box Plot
In the first section of the results interface, SCIGAMA displays box plots showing the expression of the microorganism at different sites or time points. A line has been added to the box plot to facilitate intuitive analysis of expression trends.
In the top-left corner of the figure, users can choose to plot boxplots by site or time. Below these two options, users can click on different sites or time points to view the expression of the selected microorganism more precisely. For example, if the user selects “Boxplot by Site → Ileum,” the page will display the expression of the microorganism at different time points in the ileum; If the user selects “Boxplot by Time → Control,” the page will display the expression of the microorganism within the Control group. When selecting “Boxplot by Time → Control,” the page will display the expression of the microorganism in different Sites within the Control group. When the mouse hovers over a point on the line chart or a box on the box plot, SCIGAMA will display specific statistical information.
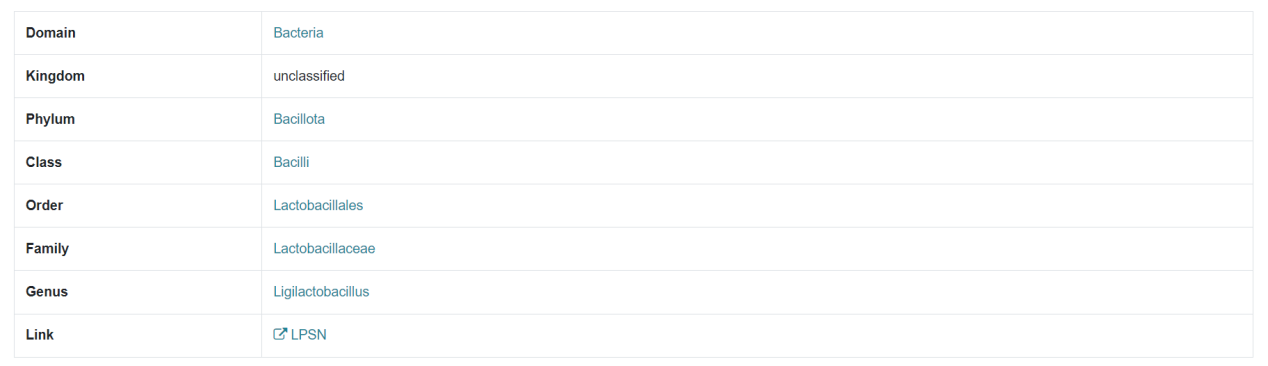
Microbial Information
The second part of the results page displays detailed information about the microorganism you searched for, including the taxonomic unit to which it belongs and the corresponding LPSN link.