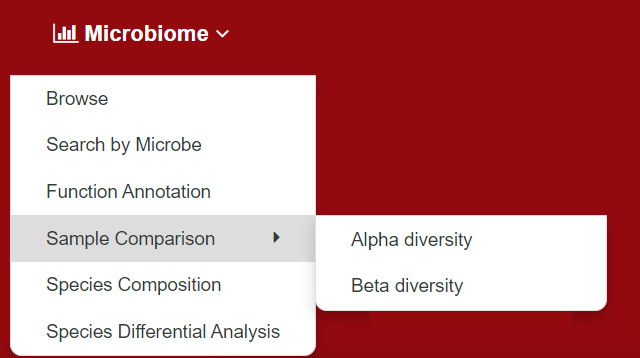
The “Sample Comparison” feature provides an in-depth analysis of Alpha Diversity and Beta Diversity for samples from different time points and different sites following spinal cord injury. This section is primarily used to display the microbial diversity in the ileum, cecum, and colon across different experimental groups (e.g., sham-treated group, 0 min, 30 min, etc.). On the homepage navigation bar, when the mouse hovers over “Microbiome,” SCIGAMA displays a submenu. When hovering over “Sample Comparison”, users can select to explore either Alpha Diversity or Beta Diversity.
Alpha Diversity
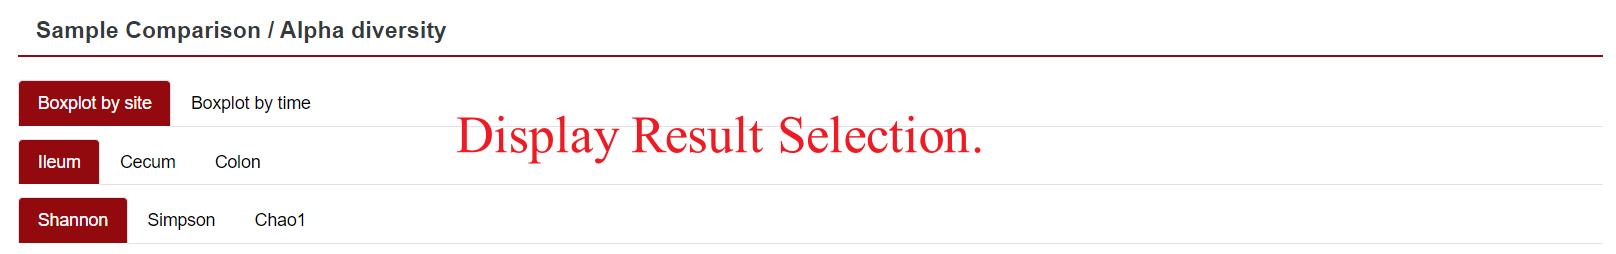
Alpha diversity is used to measure species diversity within a single sample, focusing primarily on species richness and evenness. SCIGAMA provides users with alpha diversity exploration results between different groups after spinal cord injury. Users can explore based on different sites and different injury times. Alpha diversity indicators include the Shannon index, Simpson index, and Chao1 index.
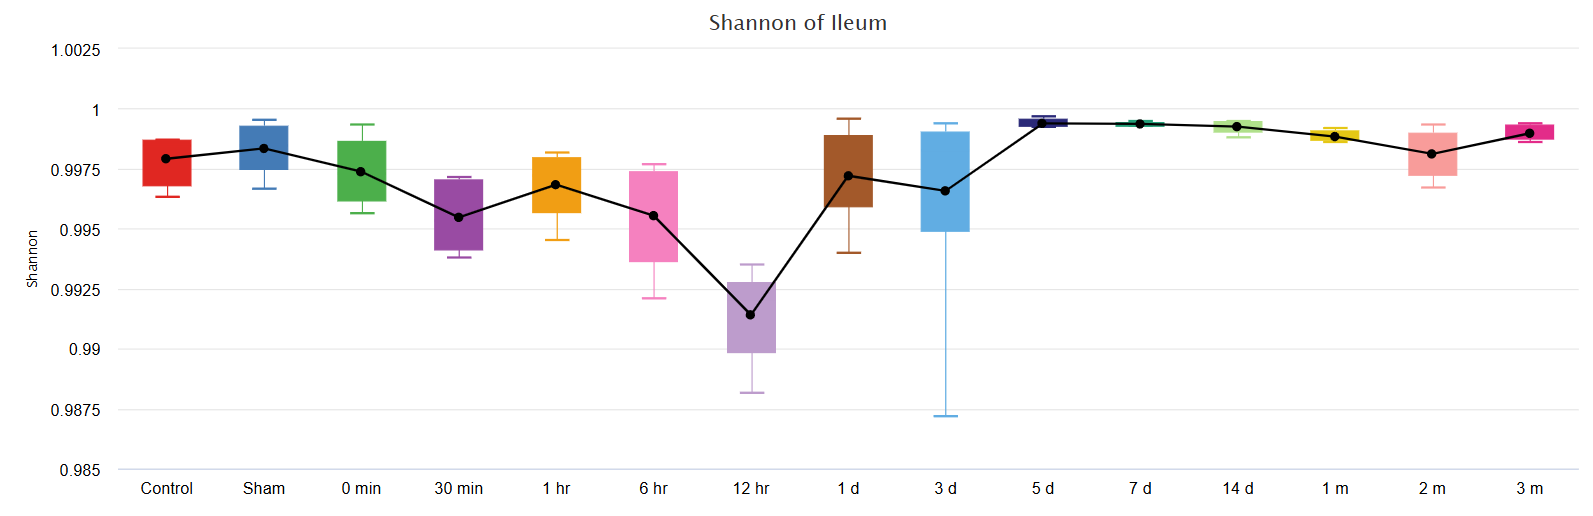
The results of α diversity are presented in box plots. Based on the user's selection criteria, box plots can show the diversity indices of each experimental group at different time points. The median line inside the box represents the median, and the vertical axis represents the relative abundance.
Beta Diversity
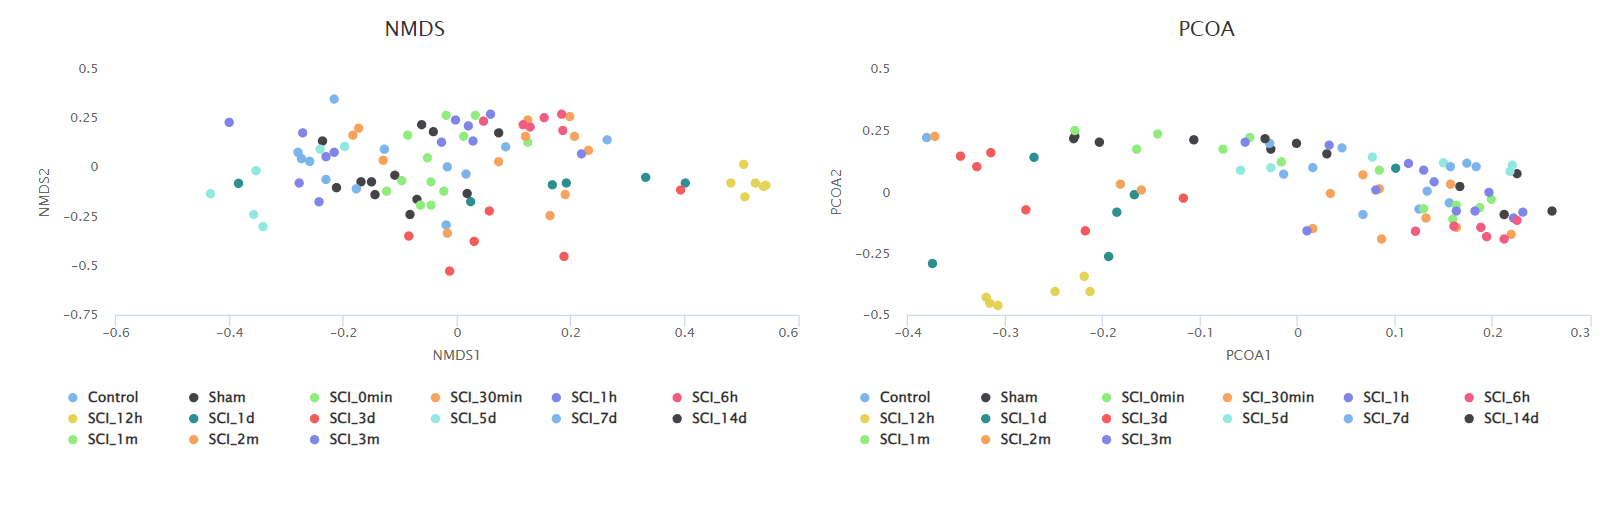
β-diversity is used to measure species differences between different sample groups, focusing on the similarity or differences between samples. The greater the β-diversity, the more significant the differences in species composition between samples. SCIGAMA provides users with β-diversity analysis results for different groups following spinal cord injury. Users can explore these results based on different sites and injury timepoints. Commonly used analytical methods for β-diversity include NMDS (Non-Metric Multidimensional Scaling) and PCoA (Principal Coordinate Analysis).
The results of β-diversity are presented in the form of NMDS and PCoA plots. Based on the user's selection criteria, NMDS and PCoA plots can display diversity indices for different time groups or site groups, with the vertical axis representing relative abundance and different colored points representing samples from different groups.