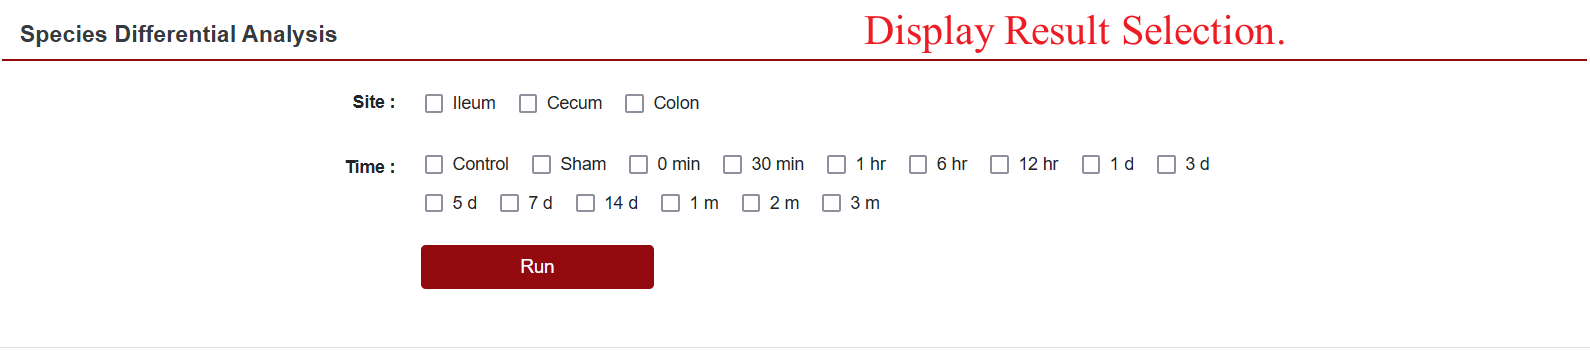
Species difference analysis helps users identify and compare species differences in microbial communities at different time points after spinal cord injury. On the home page navigation bar, when the mouse hovers over “Microbiome”, SCIGAMA displays a submenu. After clicking on “Species Differential Analysis”, SCIGAMA redirects to a new page that provides the corresponding information.
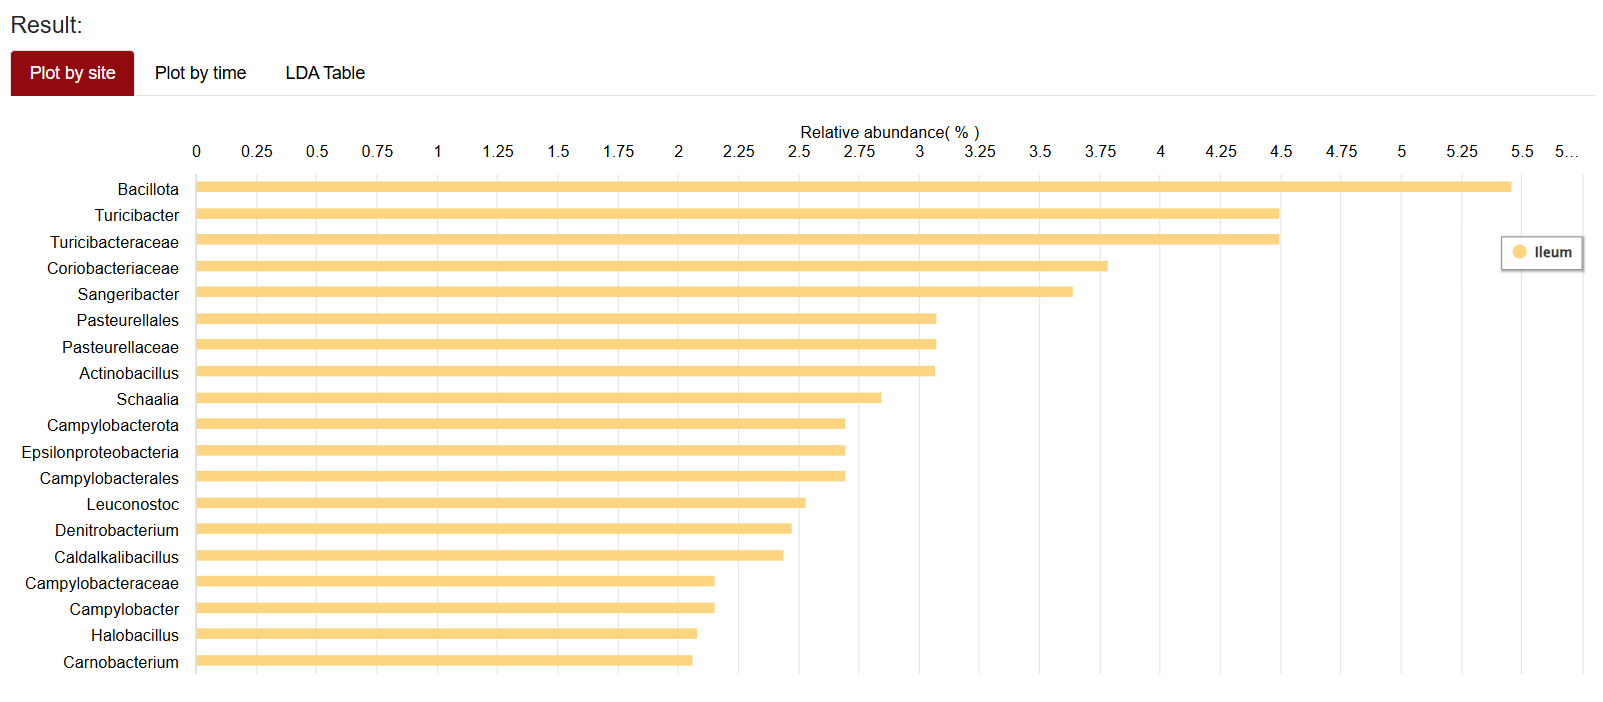
Similar to other analysis functions, in the Species Differential Analysis section, users can view the differences in microorganisms based on the site of the microorganisms and different time points after SCI. The results of Species Differential Analysis are displayed in the form of an LDA Analysis Bar Chart.
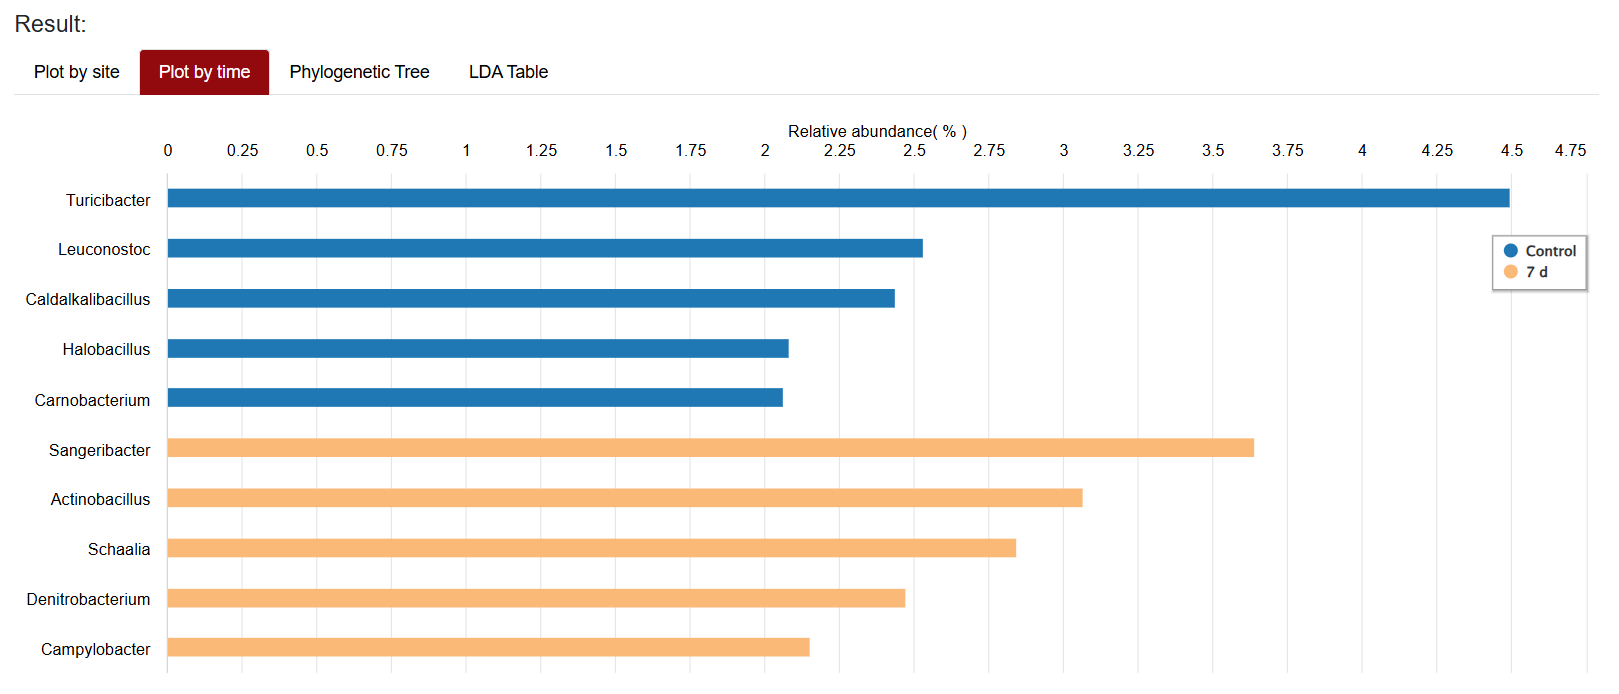
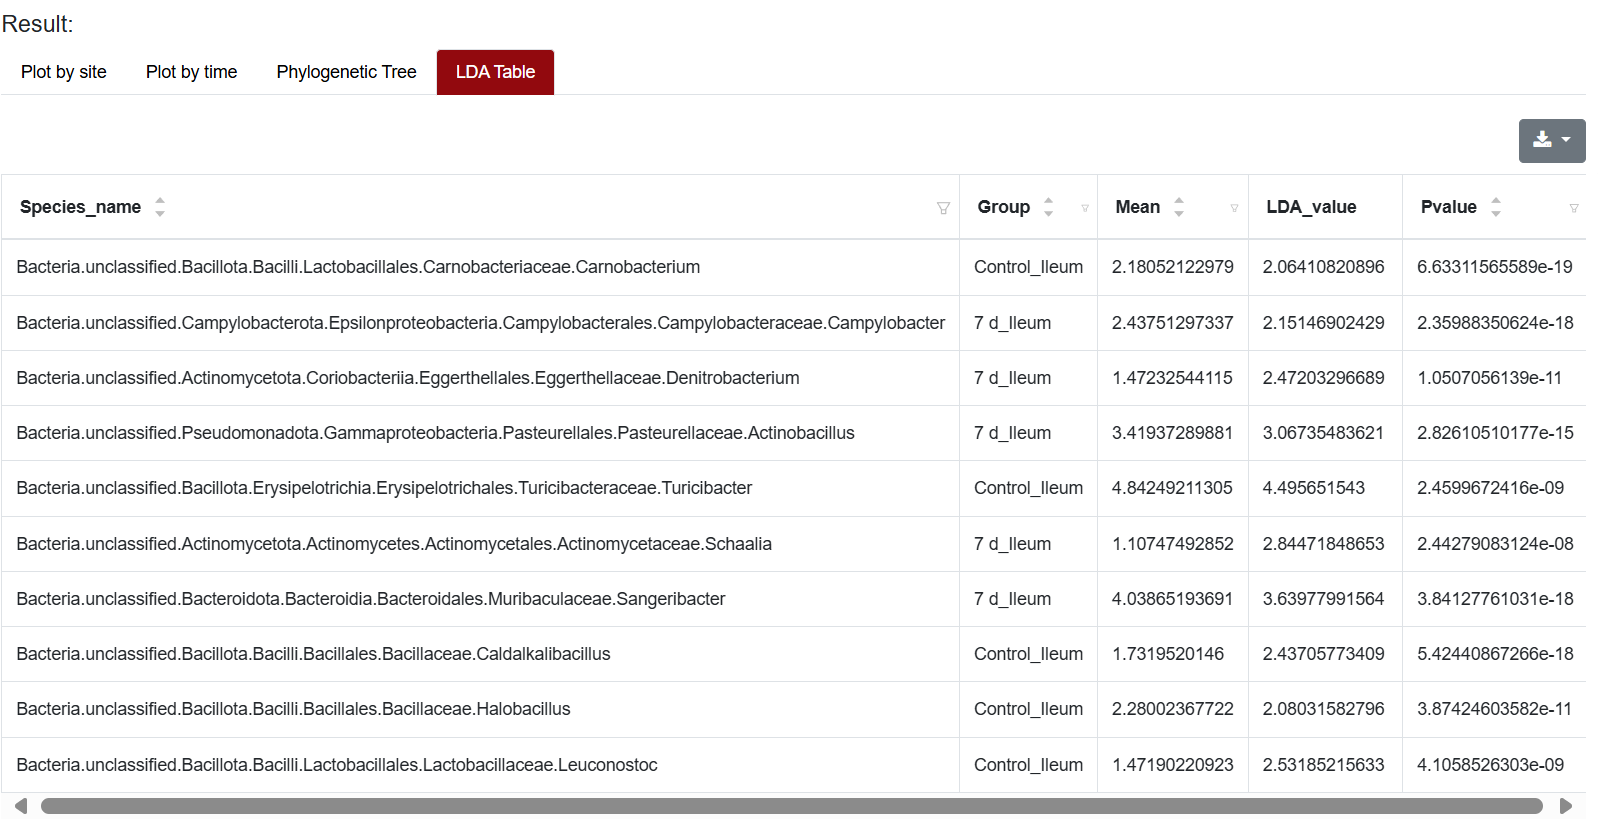
LDA Analysis Bar Chart
Through LDA analysis, SCIGAMA revealed changes in species abundance in user-selected regions and selected SCI time groups. Each bar chart represents the abundance difference of a species in different time groups, with each color representing a different source of intestinal contents. Take the data from the Control group and 7dpi group in the ileum as an example.
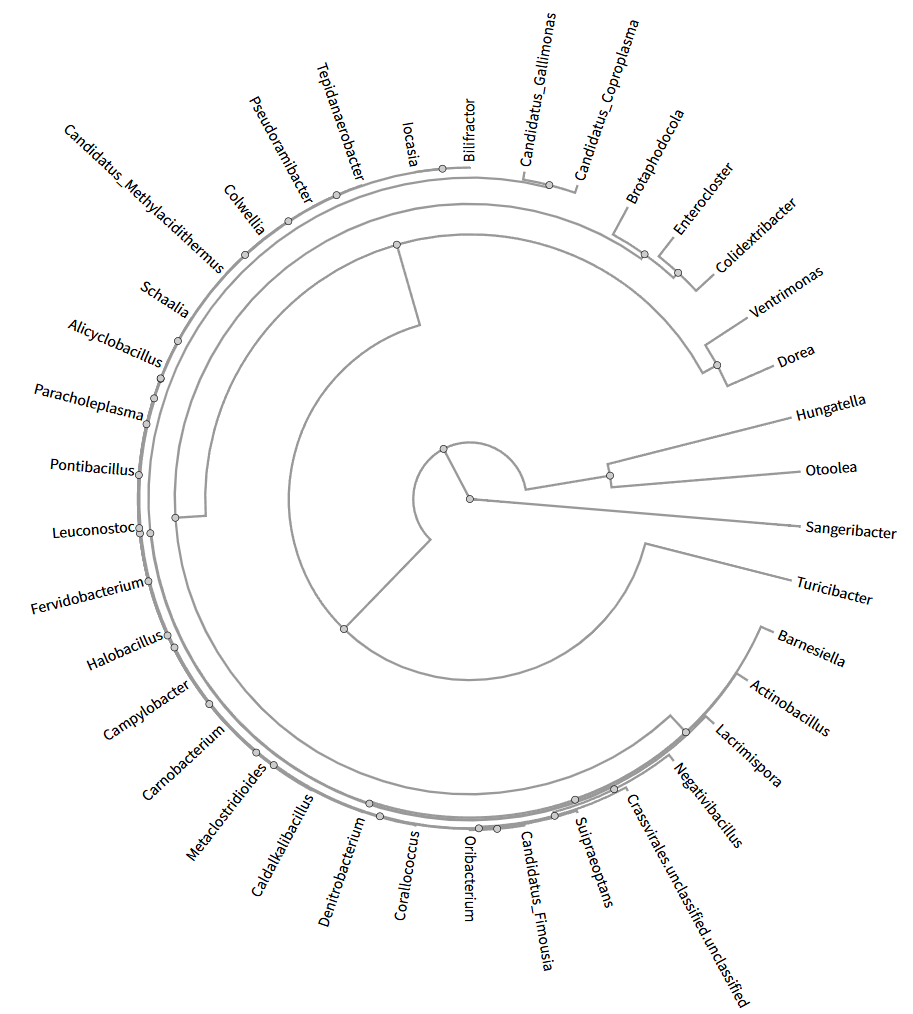
LEsFe Phylogenetic Tree
The LEfSe phylogenetic tree Function module is used to identify biomarkers (such as microorganisms, genes, and metabolites) that show significant differences between different time groups after SCI, and to visualize their taxonomic hierarchy and statistical significance through a phylogenetic tree. These time groups for comparison are set by the user.