In the Multi-Organ section, the data is exclusively managed by our team and is not sourced from public databases. We administered spinal cord injury to C57BL/6 mice and conducted RNA-seq analysis on various organs and tissues at multiple time points post-injury.
Hovering the mouse over the “Transcriptome” option in the home page navigation bar will automatically expand a submenu containing the “Multi-Organ” section. This section includes the “Search by Gene” and “Injury Related Genes” options..
1. Search by Gene
1.1 Search Interface
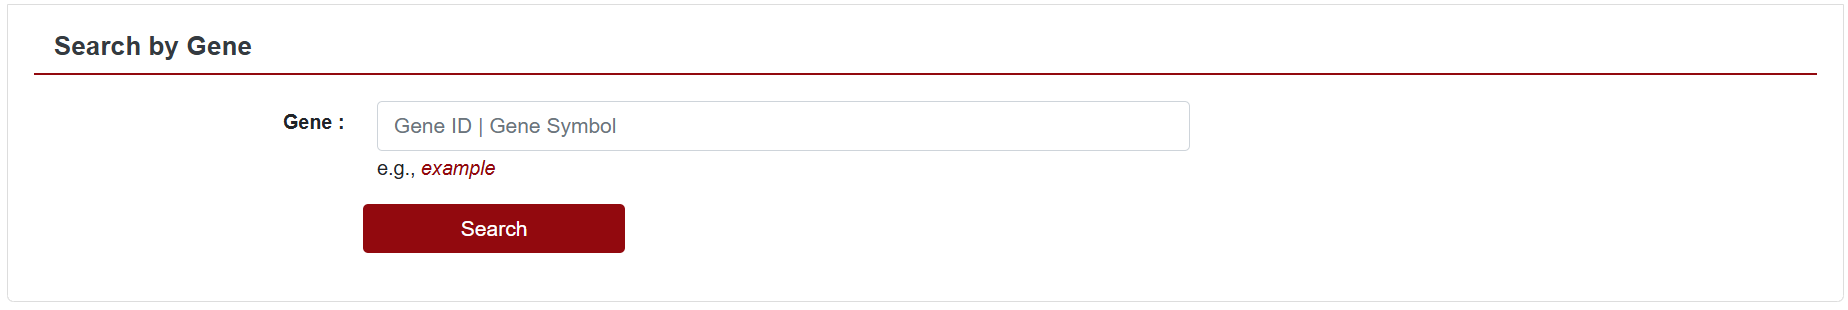
After clicking "Search by gene", SCIGAMA will jump to "Search by gene" sub-page. In this page, users can input the Gene ID or Gene Symbol for querying, SCIGAMA gives the example of "Cxcl2", after clicking "Search", SCIGAMA will give the result at the bottom.
1.2 Result Interface
1.2.1 Gene Expression Boxplot
In the first part of Result, the database displays a boxplot of the expression of the gene in different organs or at different time points. To enhance intuitive analysis of expression trends, a line is added to the boxplot.
In the upper left corner of the figure, users can choose to draw the boxplot by part or time, and below these two options, users can click on different tissues or different time points to view the expression of the selected gene more precisely. For example, if users select "Boxplot by Organ→Spinal Cord", the page will show the expression of the gene in spinal cord tissues at different time points; if users select "Boxplot by time→SCI_0min", the page will show the expression of the gene in SCI_0min. When "Boxplot by time→SCI_0min" is selected, the page will display the expression of the gene in different organs at SCI 0min. When the mouse is hovered over the points of a line plot or the boxes of a boxplot, the database will present specific statistical information.
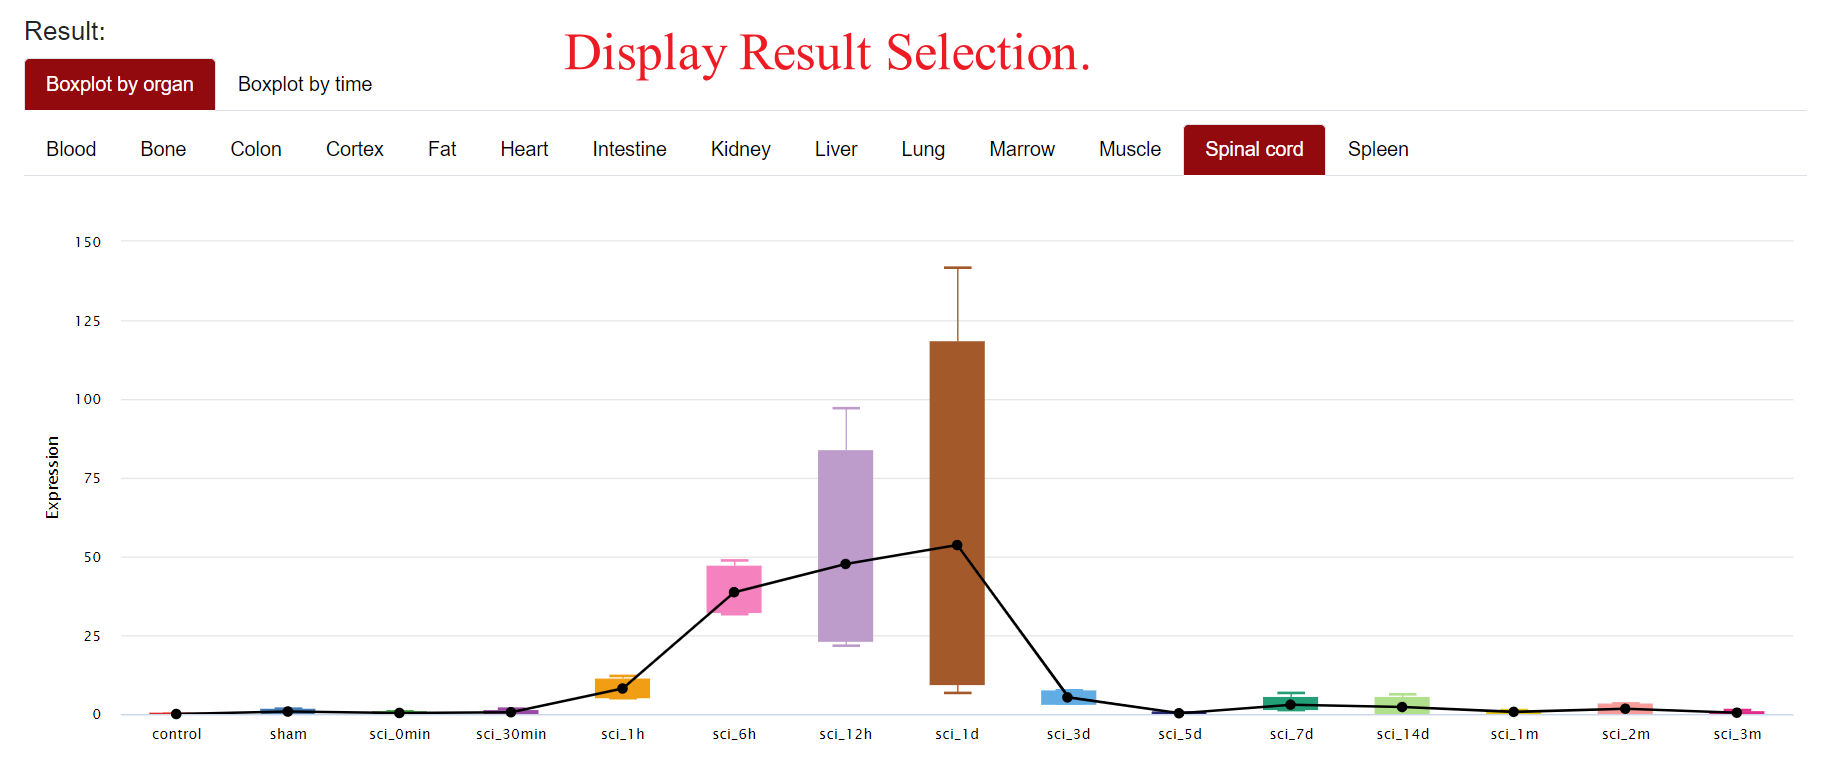
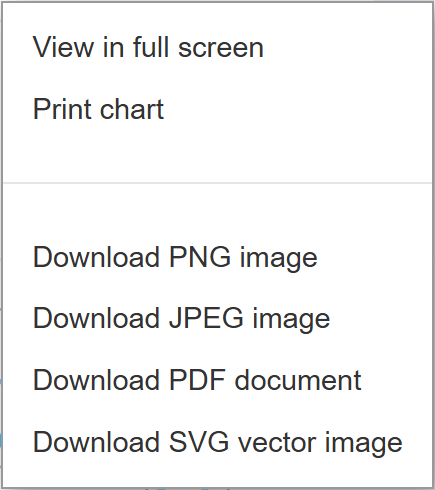
Figure Result Download
SCIGAMA supports full-screen viewing, printing, or downloading of the resulting box plot and line plot in PNG, JPEG, PDF, or SVG formats, catering to users' needs.
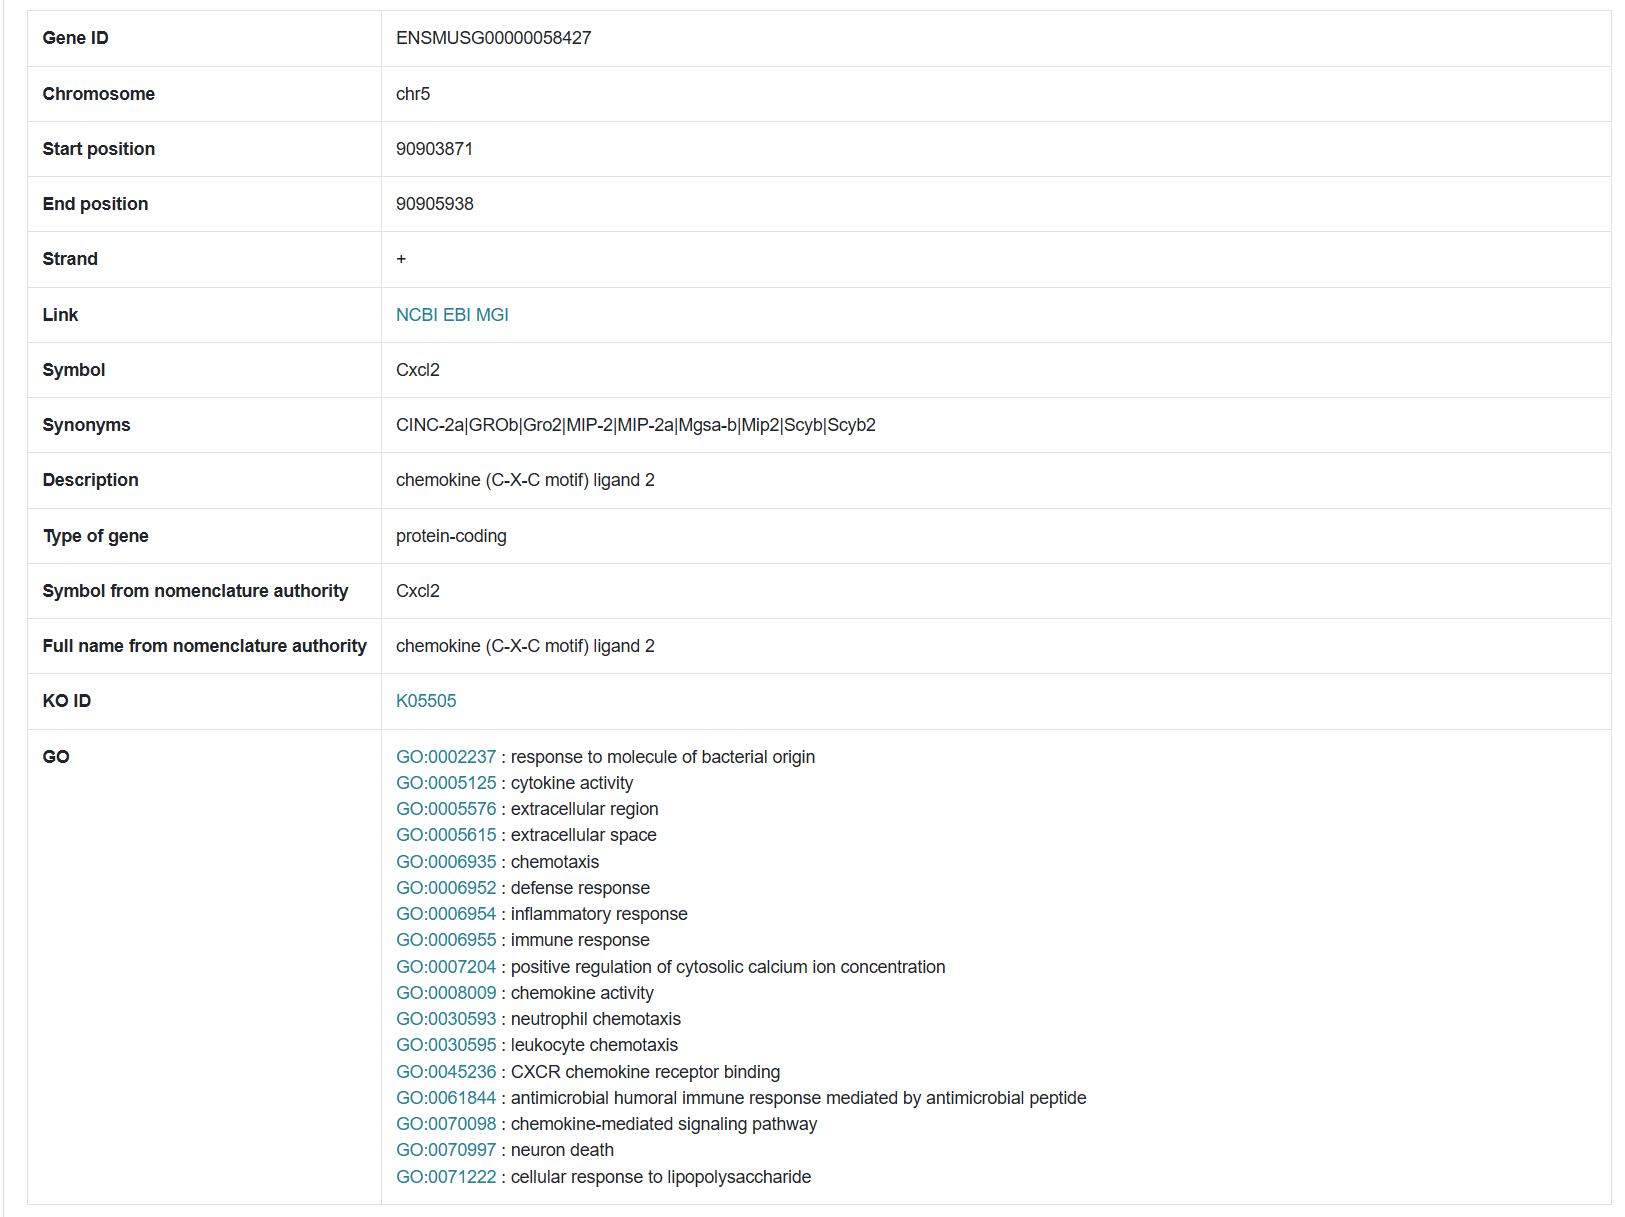
1.2.2 Genetic information
The second section of the results page displays detailed information about the queried gene, including its ID, chromosomal location, start and end positions, and associated pathways.
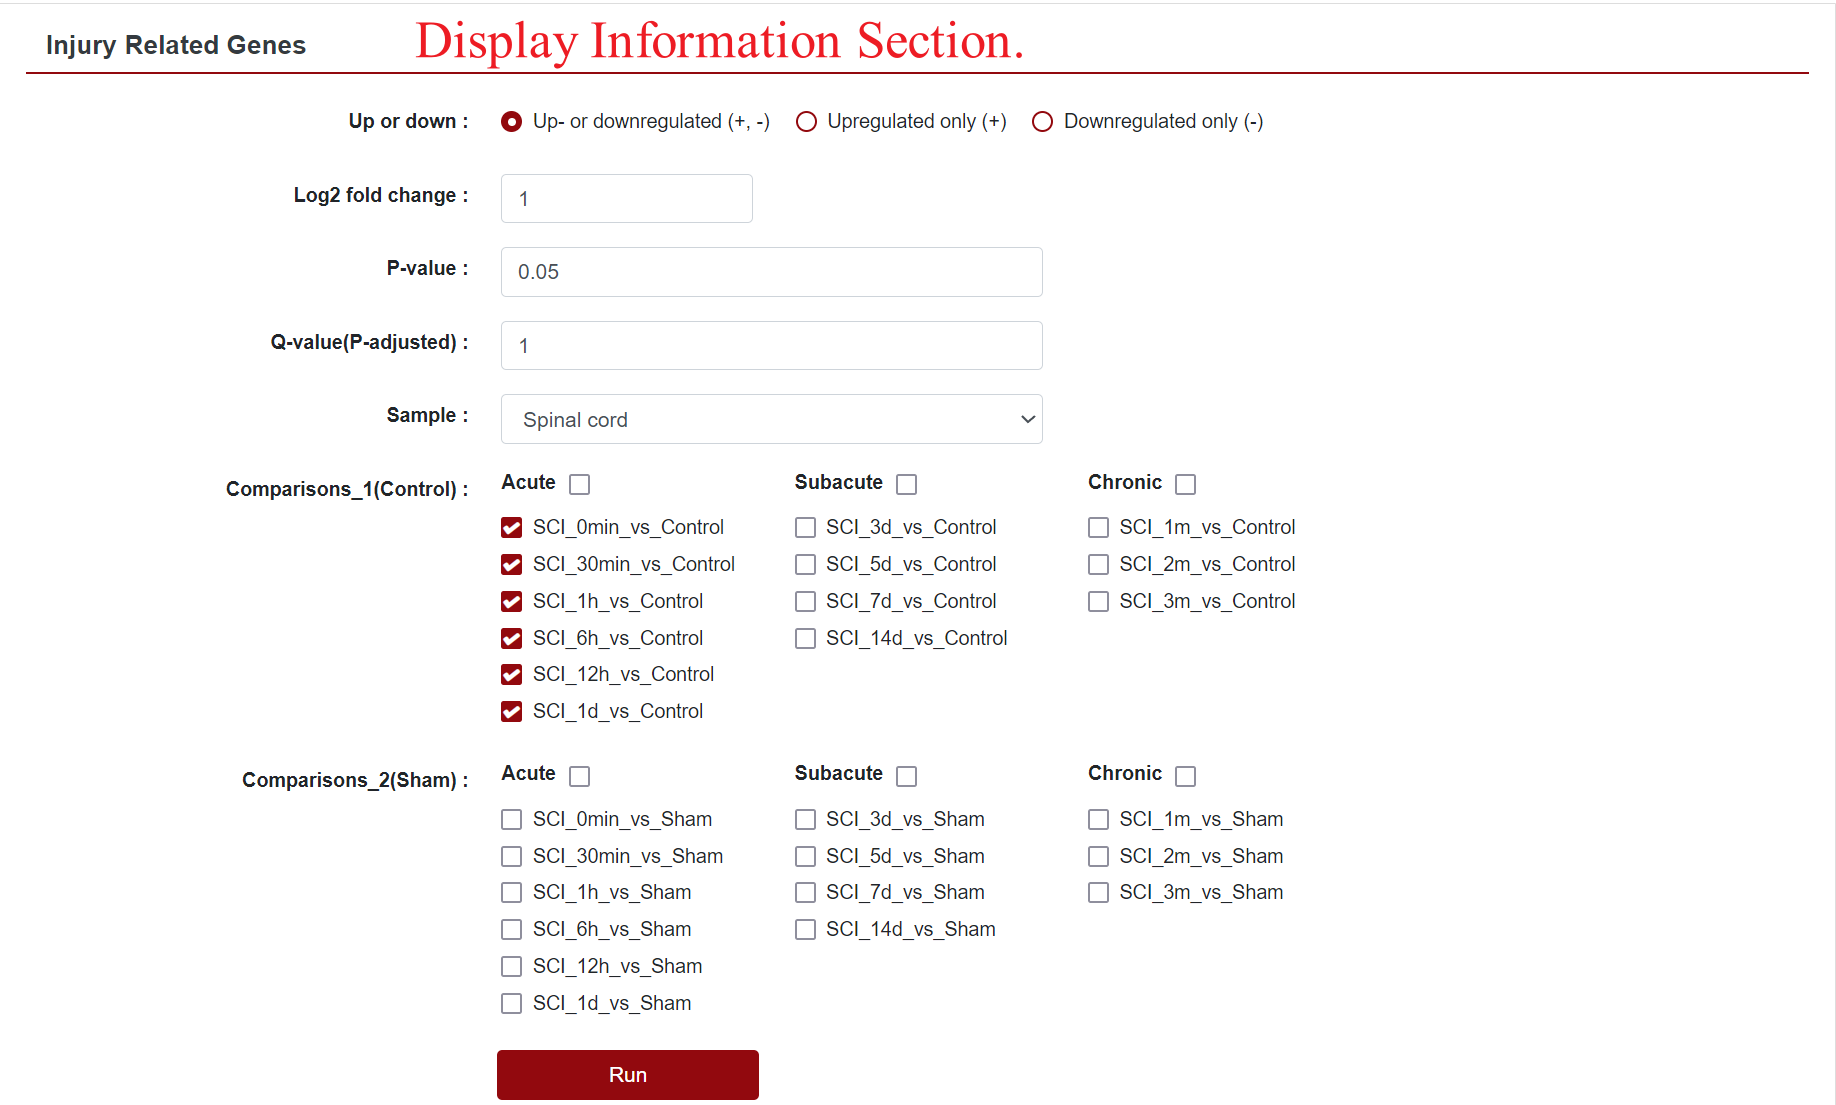
2. Injury Related Genes
Clicking on "Injury Related Genes" redirects users to a dedicated sub-page, where they can further refine their search for differentially expressed genes. Options include Up- or downregulated (+, -), Upregulated only (+) and Downregulated only (-), as well as the ability to customise the absolute value of the Log2 Fold Change and the P-value, which defaults to 1 and 0.05, respectively. Additionally, users can select their organs of interest from the "Sample" field, which filters the displayed data. The "Comparison" field allows users to change the comparison group displayed.
In this section, SCIGAMA divides "Comparison" into Comparison 1 and Comparison 2 according to the control group, which represents the comparison with Control and the comparison with the Sham group, respectively. At the same time, users can query the data according to the pathological classification of SCI. SCI are generally classified as acute (0-2 d), subacute (2-14 d), and chronic (after 14 d) according to pathological development. Once the options are set, clicking "Run" retrieves the desired results.
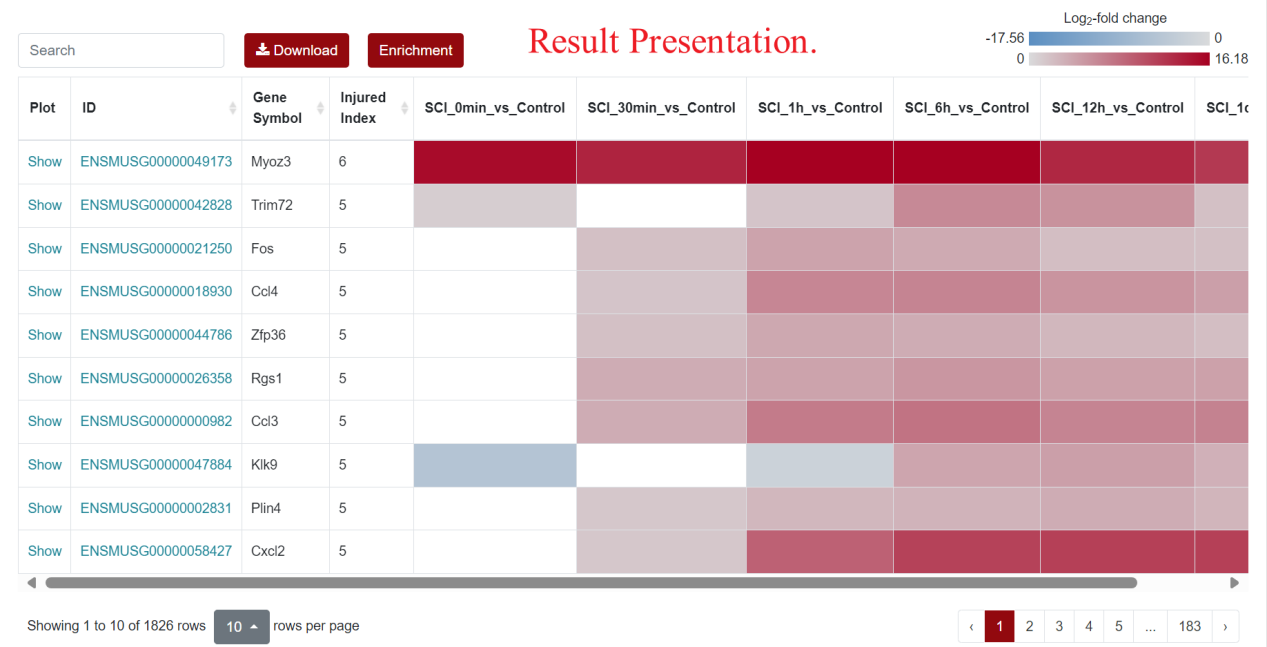
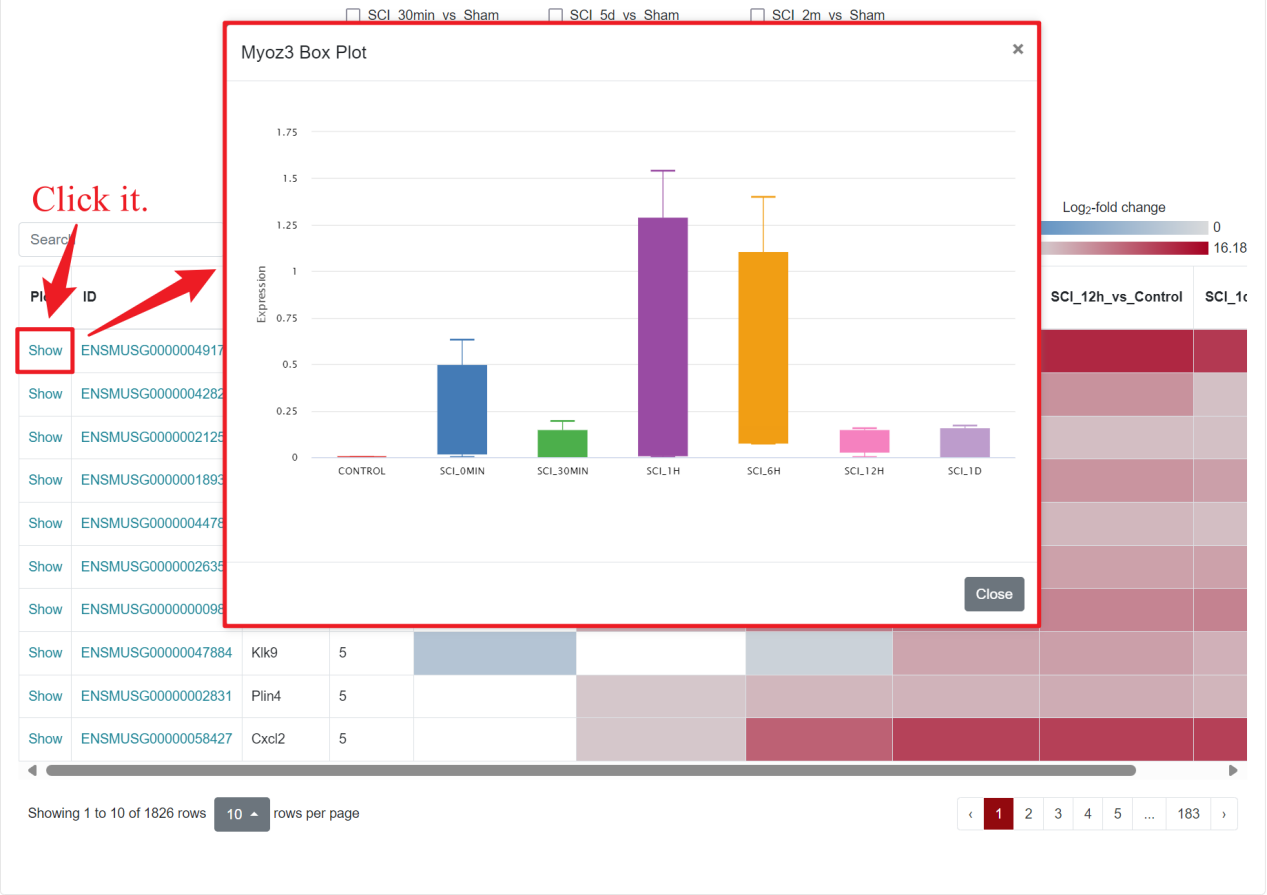
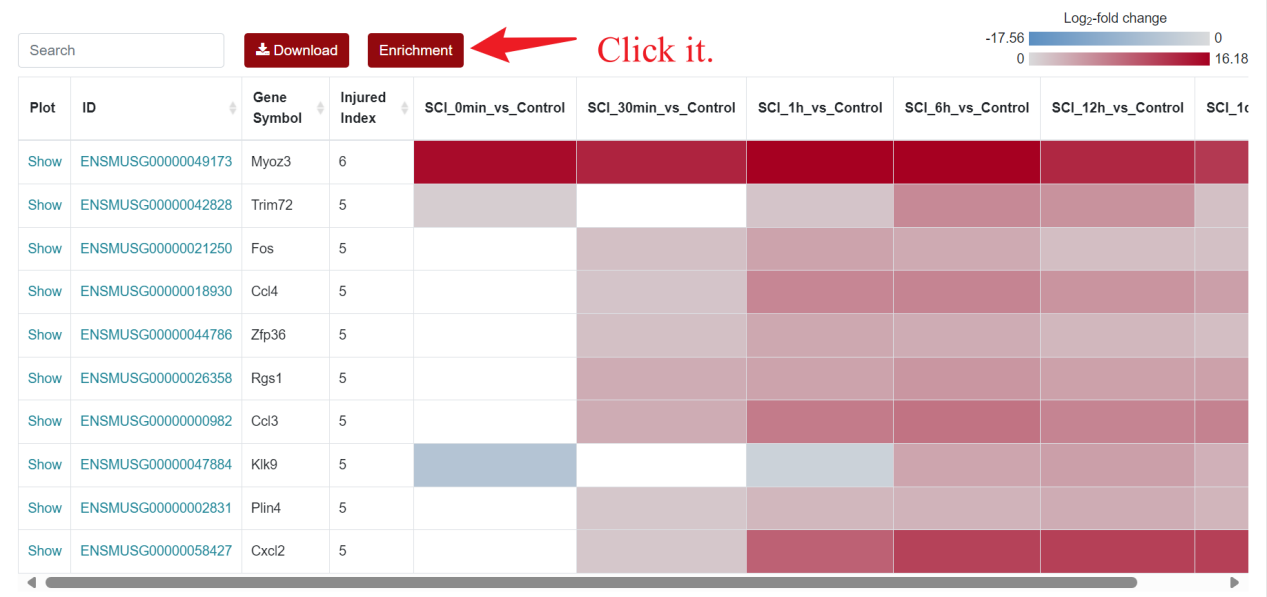
For the visualization of differentially expressed genes, SCIGAMA adopt the heatmap approach, similar to other sections. At the top left of the result figure, there is a "Search" box for users to find the gene they want to focus on in the result. In addition, there are "Download" and "Enrichment" buttons on its right side. The "Plot" column contains the expression of each gene, and here we use a box-and-line plot to show the expression of the gene at different time points. The "ID" column represents Ensembl gene IDs, while "Gene Name" provides the gene's name. In different "Comparison" columns, the column name means the comparison information of the group; the color represents the differential expression status of the gene. In each "Comparison" columns, the name of column implies the comparative information of the groups; the color represents the differential expression of the gene, red means up-regulation, blue means down-regulation. The color of each gene represents the differential expression of the gene, red means up-regulation, blue means down-regulation. The shade of the color represents the size of the Log2 Fold Change, the larger the absolute value, the darker the color. When the mouse hovers over the color block of the corresponding gene in the "Comparison" column, the specific Log2 Fold Change and P-value of the gene will be displayed.
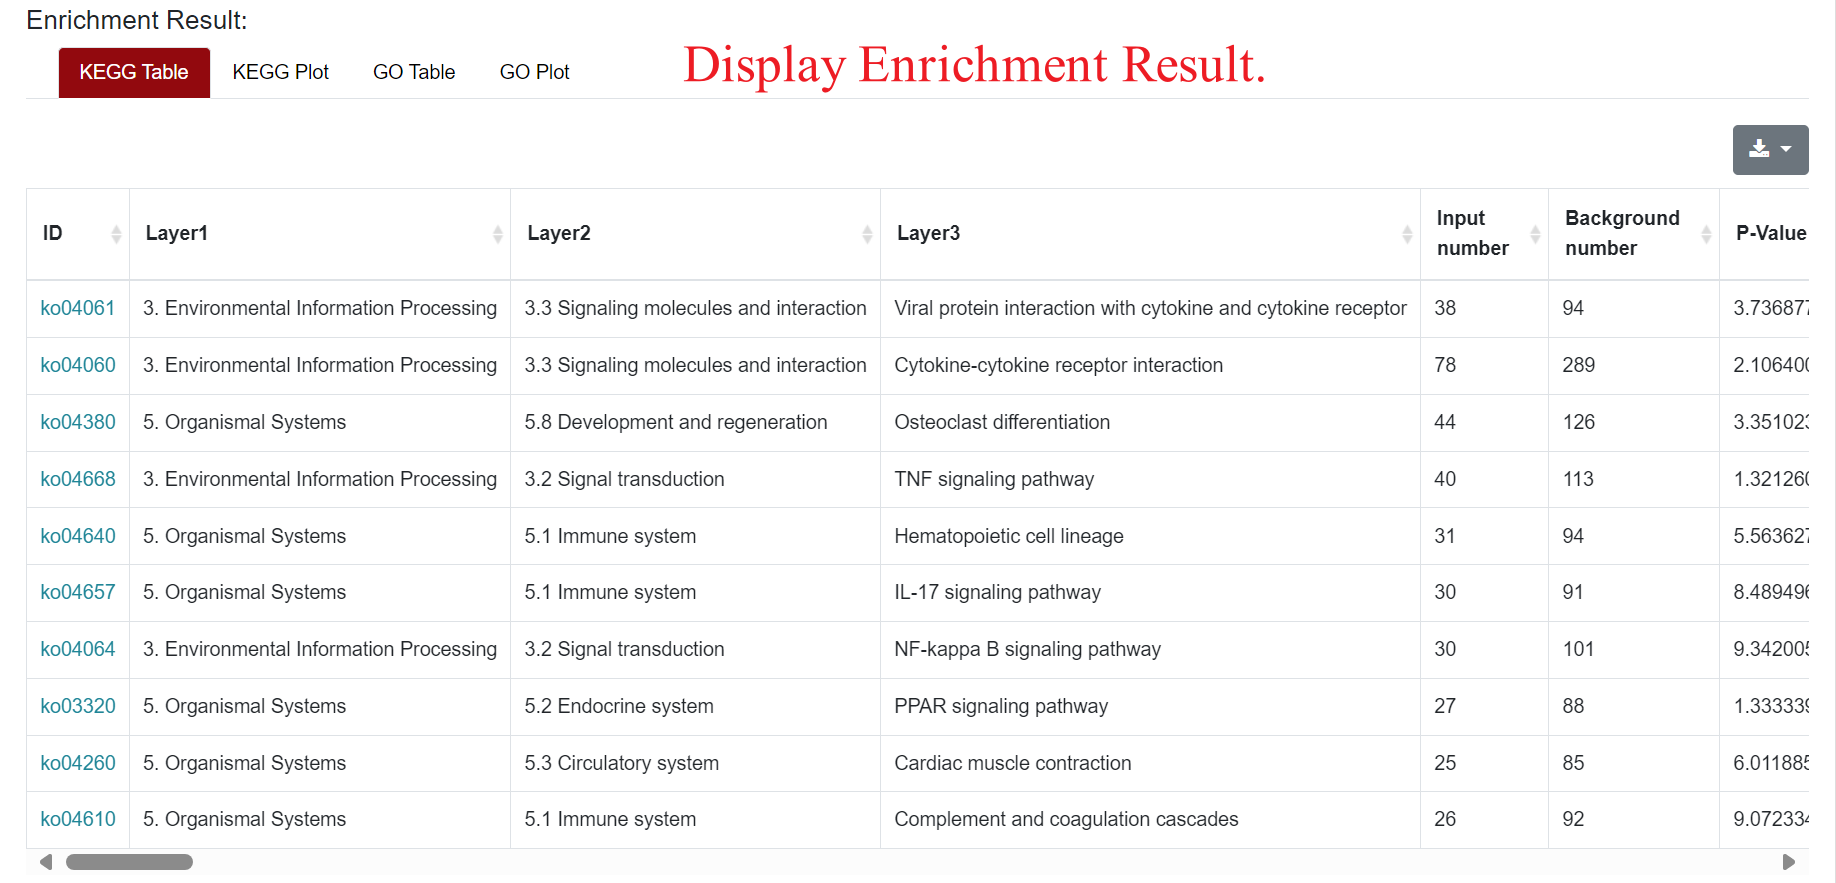
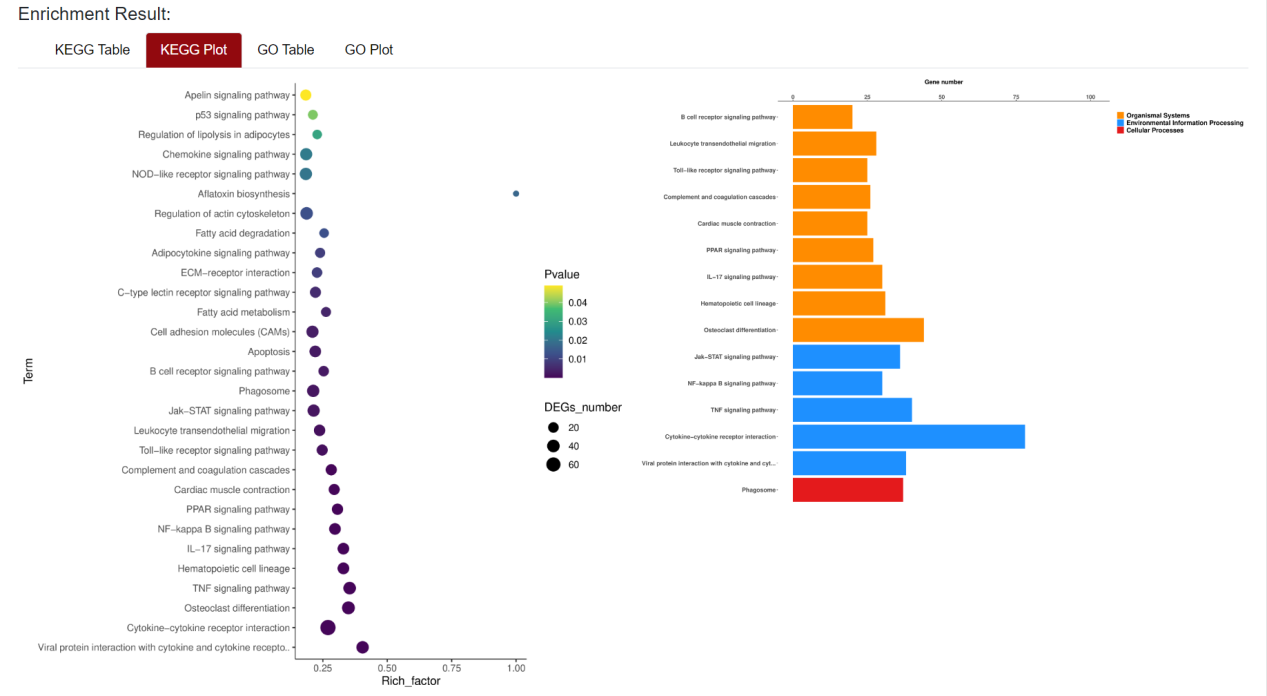
An "Enrichment" button, located next to the search bar at the top left of the table, enables enrichment analysis of differentially expressed genes, including KEGG and GO analysis. The results of the analysis are shown in Table and Plot, the first three columns of KEGG Table are the three levels of KEGG classification, and the "ID" corresponds to the KO identifier enriched in the KEGG database. "Input number" represents the number of differentially expressed genes annotated to KEGG metabolic pathway or functional category. Similarly, "Background number" represents the number of genes annotated to KEGG metabolic pathway or functional category in the list of all detected genes. KEGG Plot is a graphical representation of the results of KEGG enrichment analysis. KEGG Plot is a graphical representation of the results of KEGG enrichment analysis.
Result Presentation
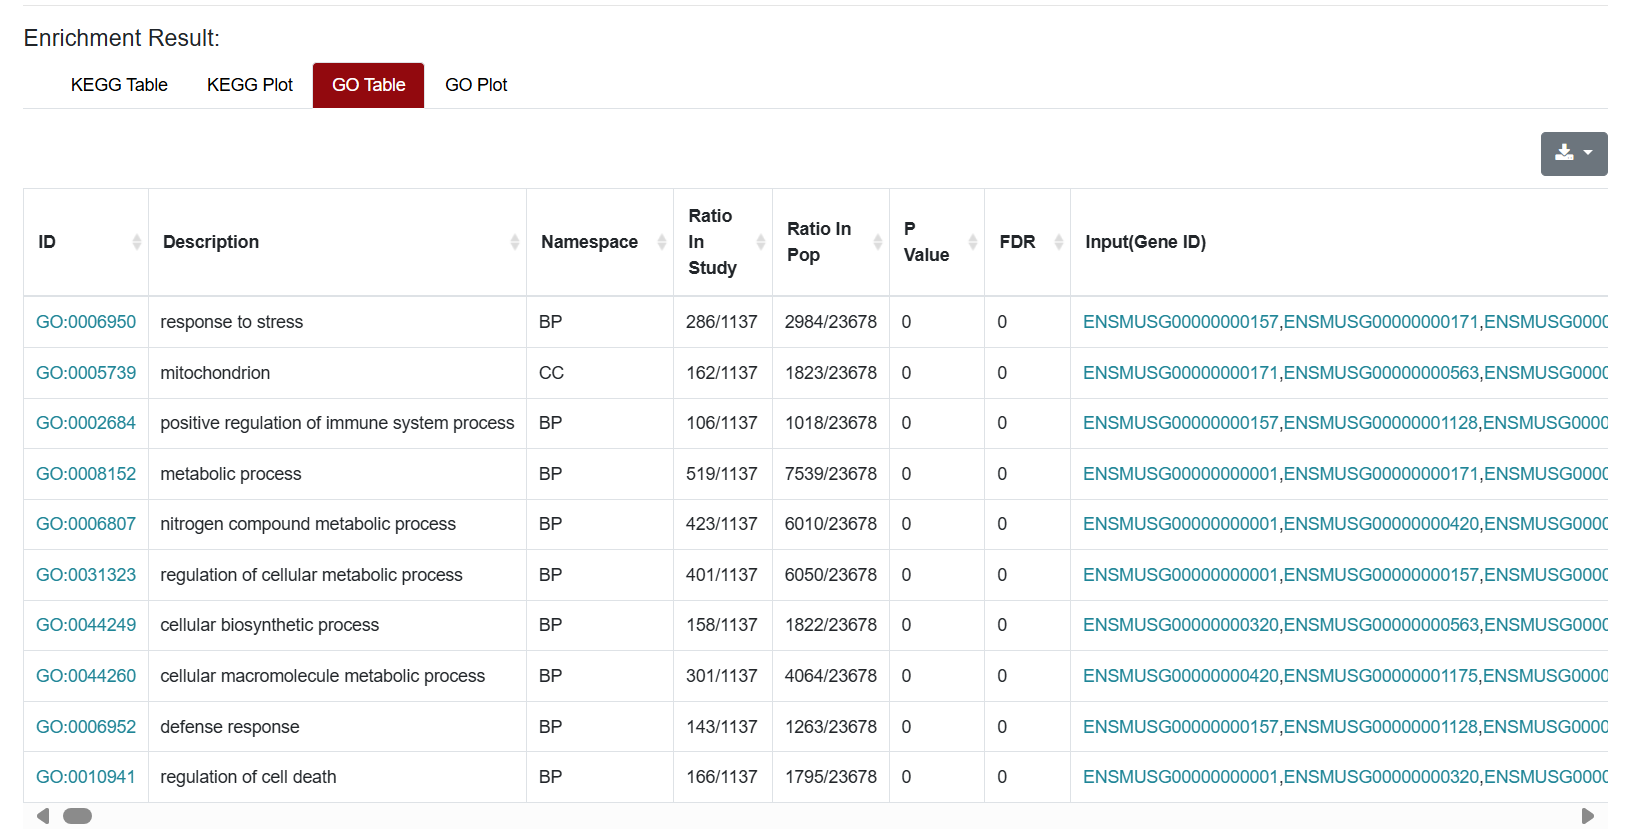
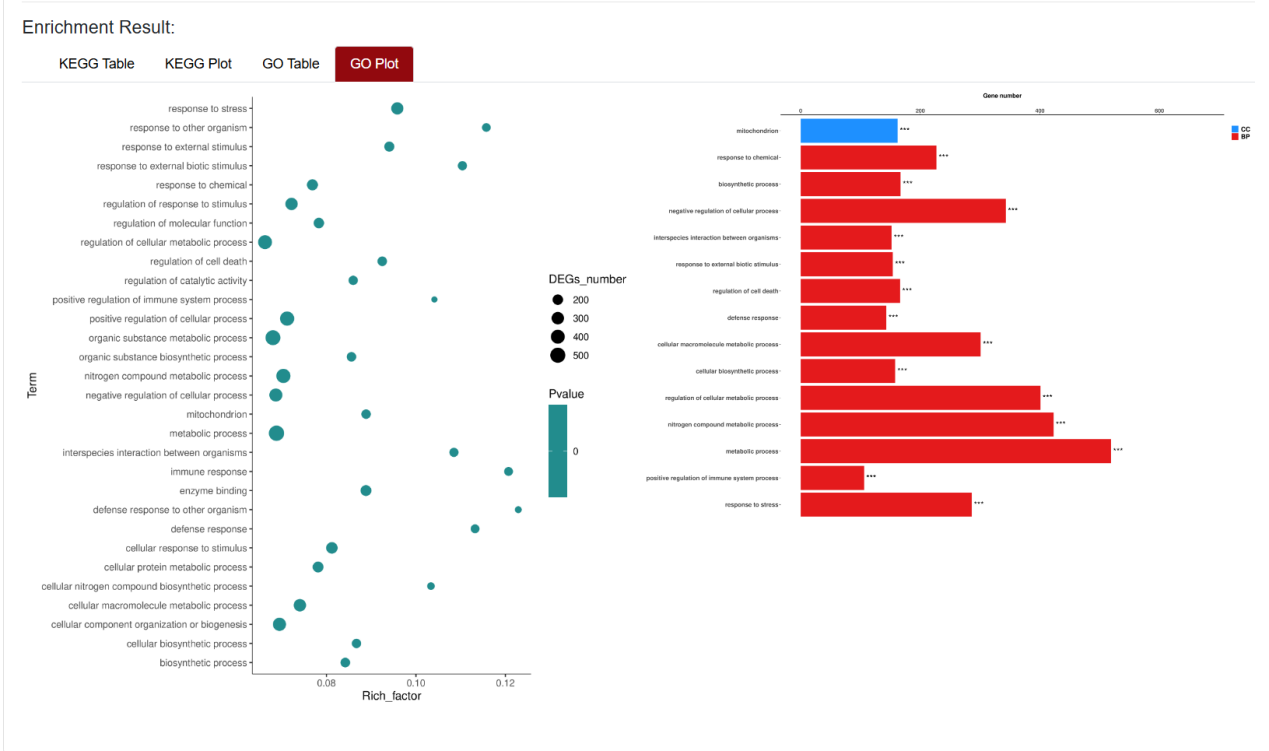
Similarly, the results of GO enrichment analysis were also presented in Table and Plot. In the Table section, the "ID" column represents the enriched GO ID, the "Description" column contains the description of the pathway, and the "Namespace" represents the classification of GO analysis, including Biological Process (BP), Cellular Component (CC) and Molecular Function (MF). "Ratio in study" represents the ratio of the number of differentially expressed genes annotated to this GO term to the total number of genes in the prospective dataset; "Ratio in pop" represents the ratio of the number of genes annotated to the GO term to the total number of genes in the background dataset for the whole genome.