On the home page, click or hover over the “Transcriptome” option in the navigation bar, and SCIGAMA will pop up a submenu. Click the “Trend” option in the Analysis section, and SCIGAMA will jump to a new page where users can select the organ data they are interested in viewing. SCIGAMA provides fuzz-clustering results for a wide range of organs, and users can view these results by selecting the organs they interest in. The spinal cord sample is shown here as an example.

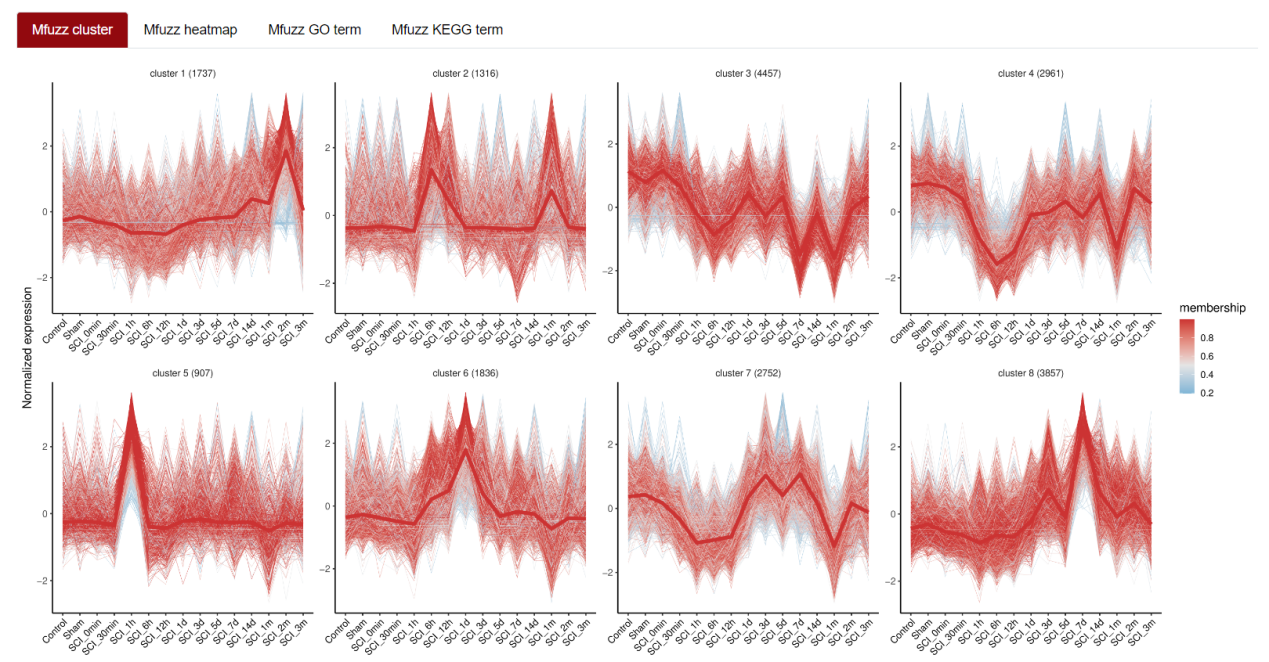
1. Mfuzz
Mfuzz excels in recognizing latent time-series patterns within expression profiles, grouping genes with comparable patterns. This clustering helps us comprehend the dynamic behaviors of genes and how they functionally relate to each other. By default, SCIGAMA organizes all genes into 8 clusters. Once the organ of interest is selected, users can view the Mfuzz results for this organ. Presentation of Mfuzz results includes figure and table.
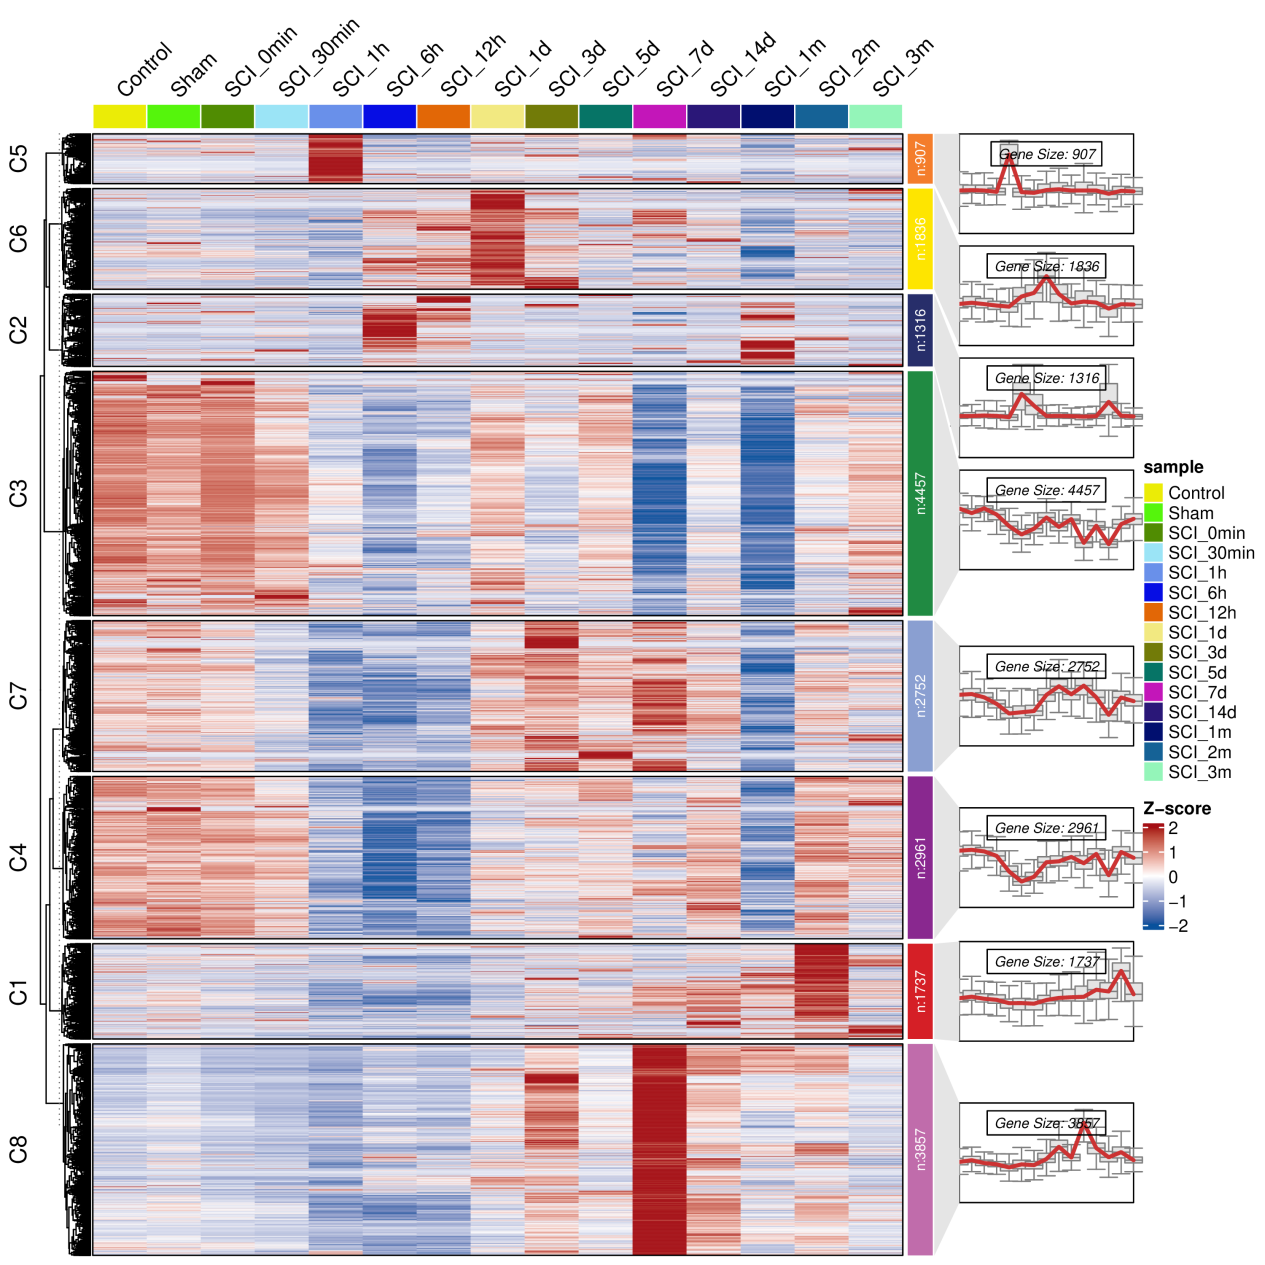
2. Mfuzz_Heatmap
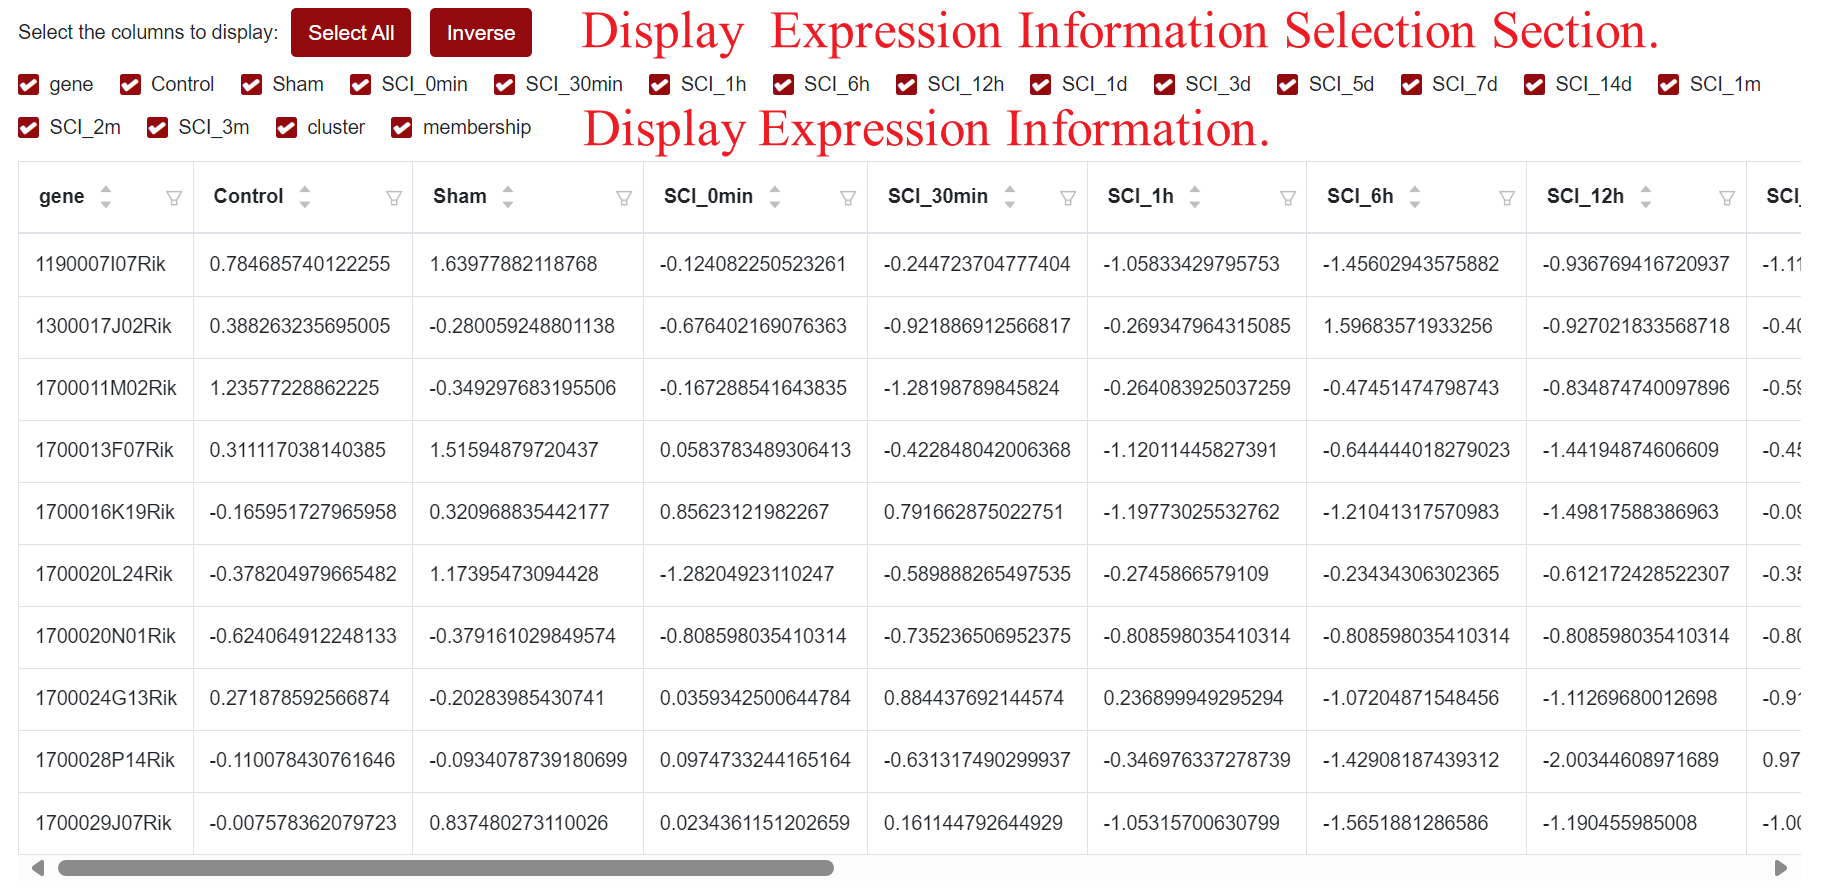
Using the multiple clusters derived from Mfuzz analysis, SCIGAMA presents heatmaps that illustrate the genes within these clusters. For instance, when visualizing Blood, it becomes evident that the heatmap results align with the expression trends observed in the clusters. Notably, the visualization outcomes of Mfuzz_Heatmap are indeed reflected in the Mfuzz_GO_term panel. Users can also view gene expression information in the table below.
3. Mfuzz_GO_term
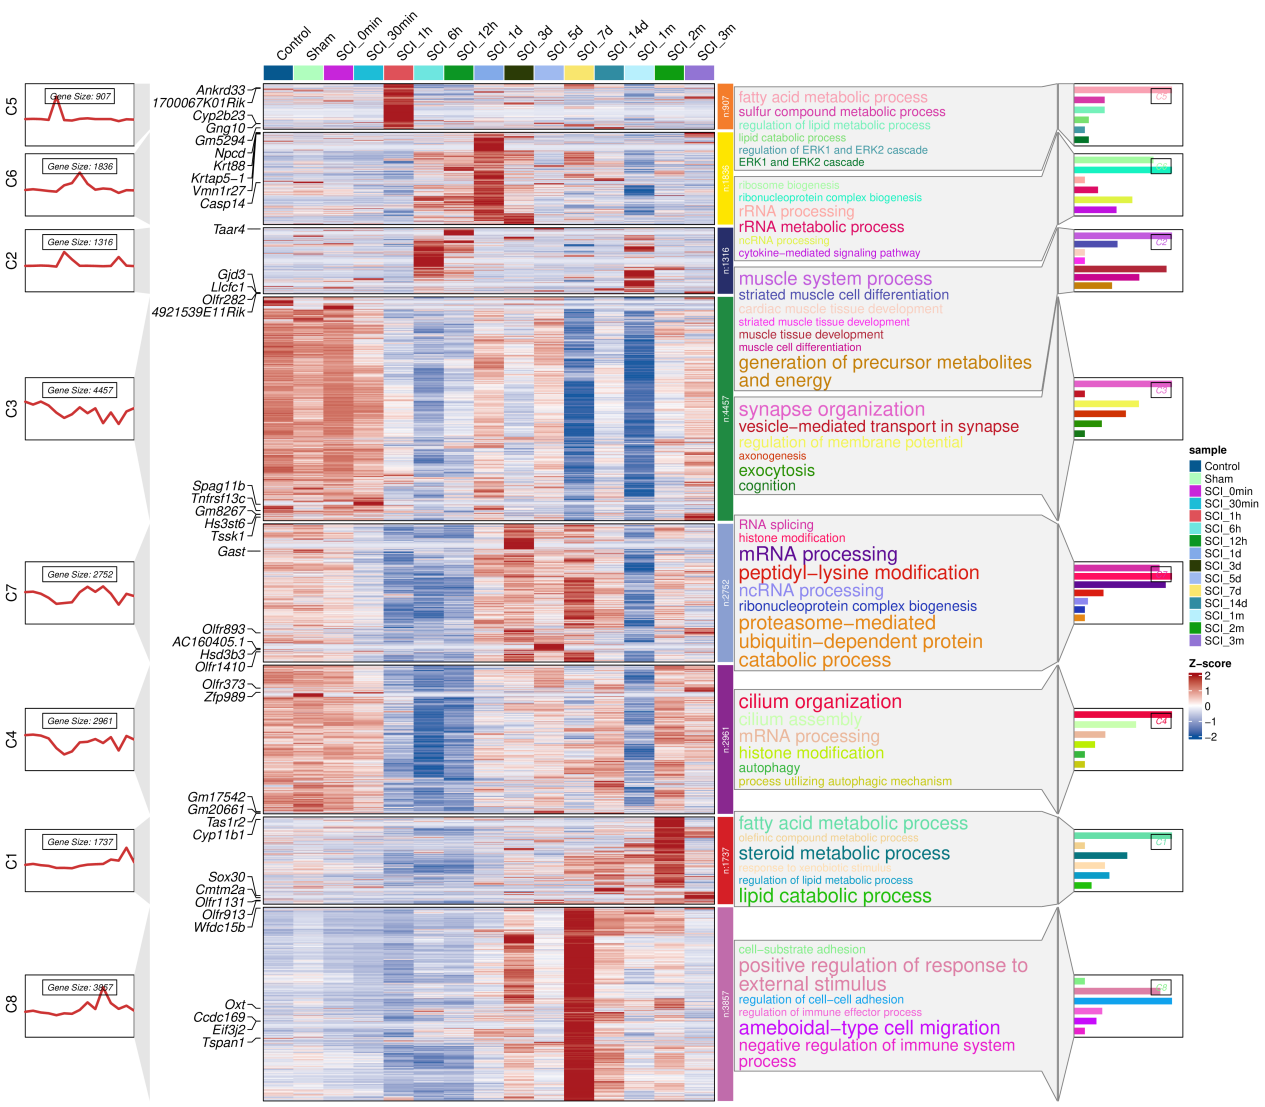
Generally, SCIGAMA divides the differentially expressed genes into 8 clusters by Mfuzz method. In this section, SCIGAMA performs GO enrichment analysis of the results according to different clusters and presents the results in the form of heatmaps and histograms.
Take the visualisation results of Blood as an example. On the leftmost side, different clusters and their expression trends are displayed, and in the middle, the specific genes contained in these clusters at different time points is displayed. It can be found that the results of the heatmap match the expression trend of the clusters. On the right side of the heatmap are shown the results of the number of genes in the clusters as well as the results of GO enrichment, including the biological processes enriched to as well as the bar plots. Users can also view gene expression information in the table below.
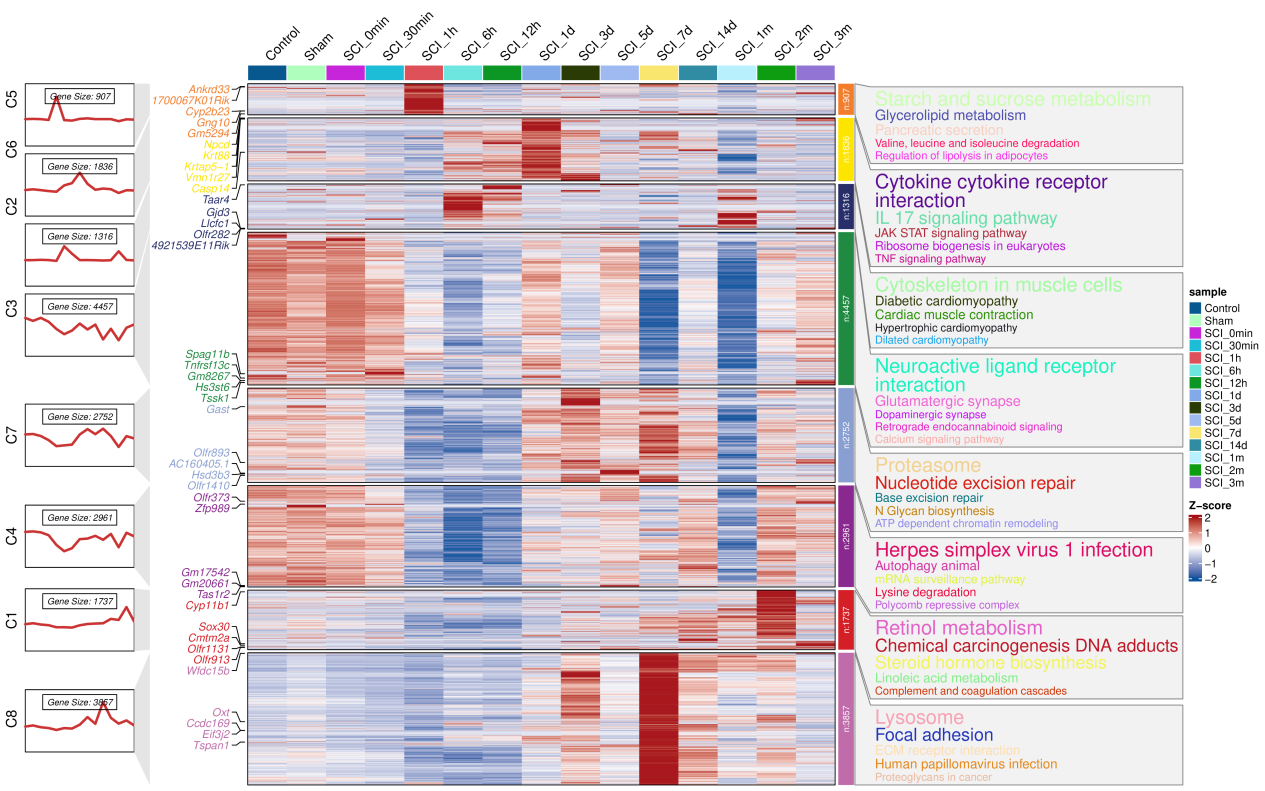
4. Mfuzz_KEGG_term
In this section, SCIGAMA, similar to GO_Term, conducts a KEGG enrichment analysis the results of clusters and visualizes them alongside a Heatmap. Using Blood visualization as an example, the leftmost section showcases various clusters and their corresponding expression patterns. The heatmap in the middle section shows the differential expression of genes in these clusters over different time intervals. Notably, the outcomes of heatmap align precisely with the expression trends of clusters. On the right side of the heatmap, users can find details about the gene count within each cluster, accompanied by the results of the KEGG enrichment analysis.