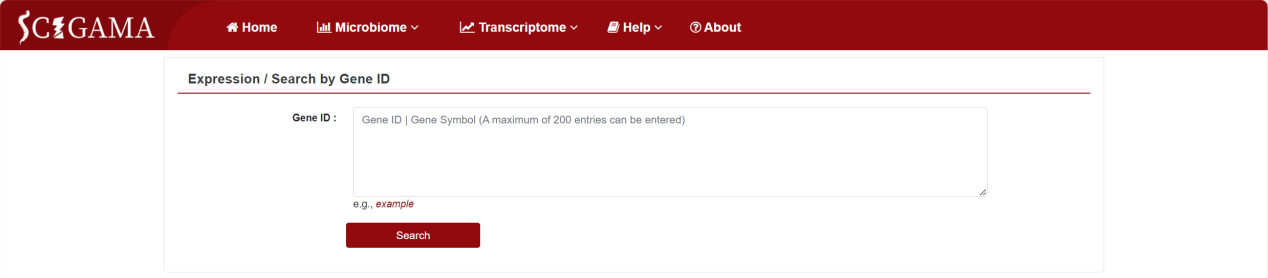
On the homepage, click or hover over the “Transcriptome” option in the navigation bar, and SCIGAMA will display a submenu. Under the ‘Analysis’ section, there is an “Expression” submenu, which includes gene ID search, miRNA ID search, GO ID search, and KEGG pathway ID search. Clicking on different options will redirect you to the corresponding new page.
1. Search by Gene lD
After clicking Search by Gene lD, SCIGAMA will redirect to a search interface where users can enter the name or Ensembl ID of your target gene in the search box. It is worth noting that users can enter up to 200 genes at the same time. For demonstration purposes, we will use example data from the database (Ptgs2, Relb, Ccl4, Cxcl2, Tnf, Cd40, Cd40lg, Traf1, Traf2, Rigi, Cd14, Nfkb2, Ptgs2, Trem1, Nlrp3) .
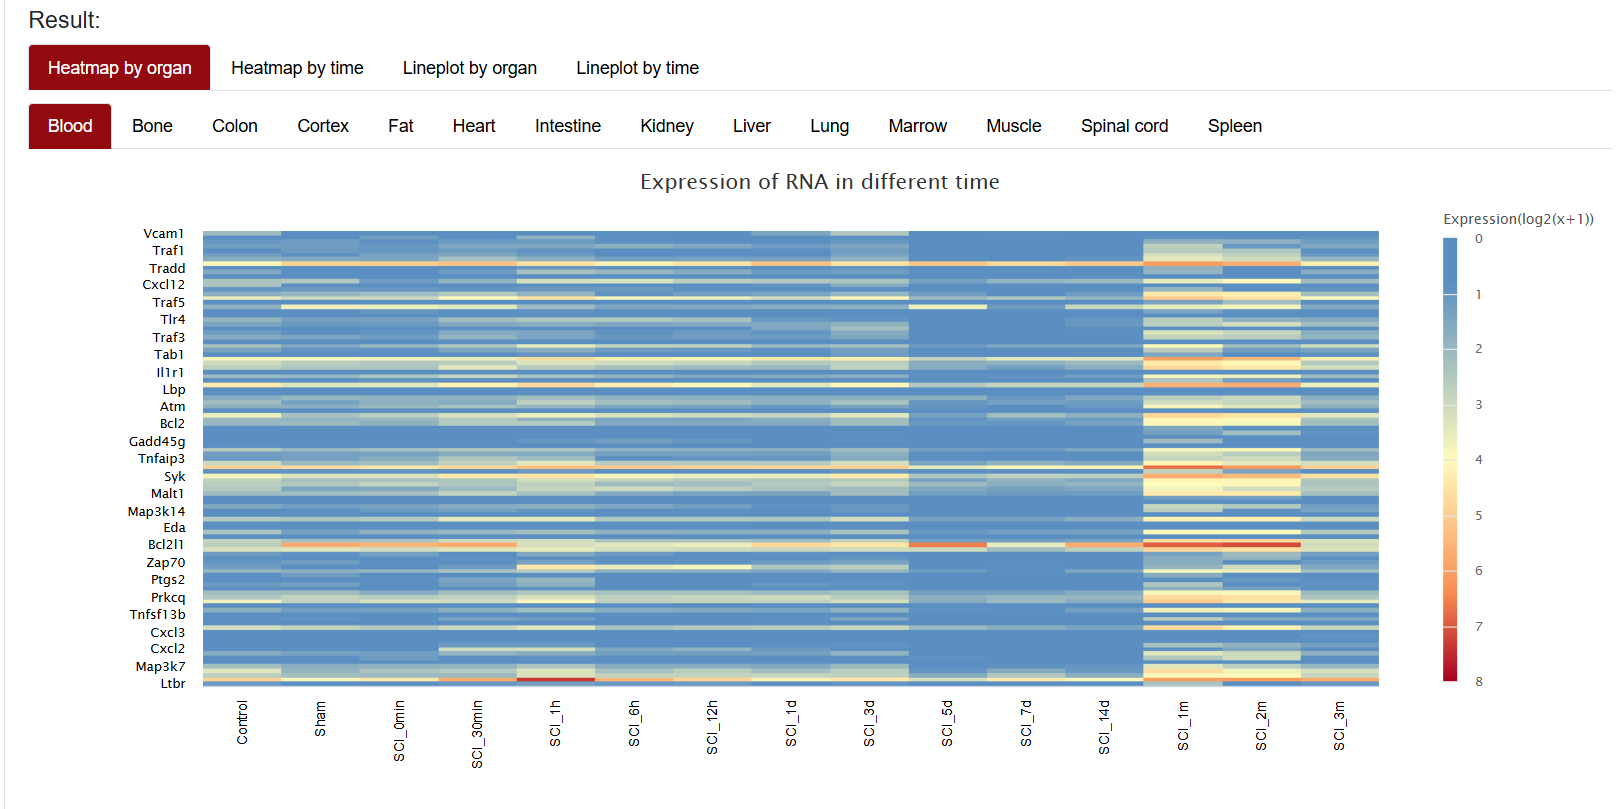
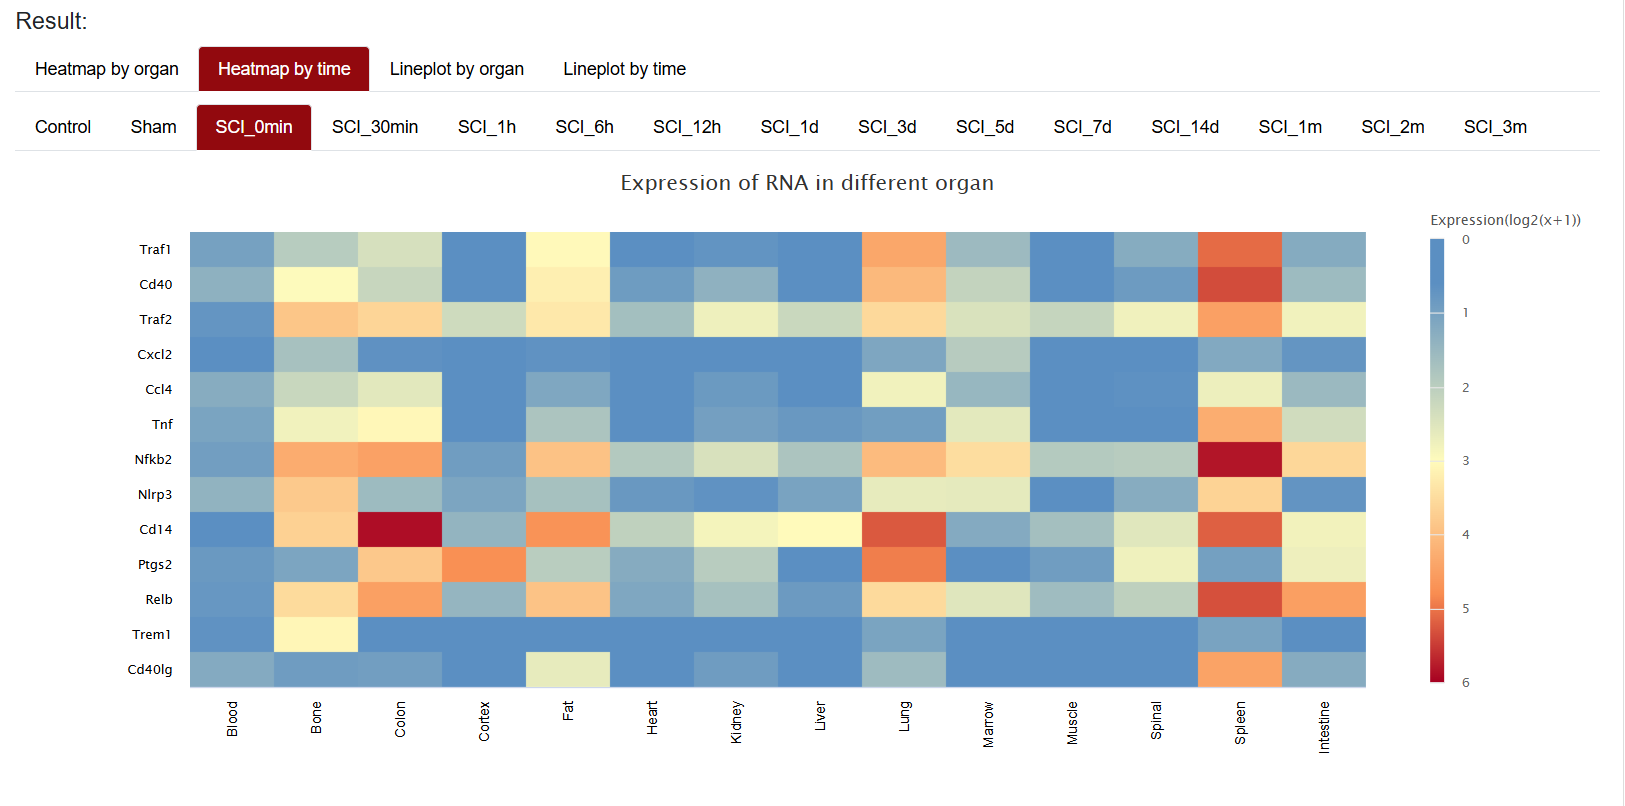
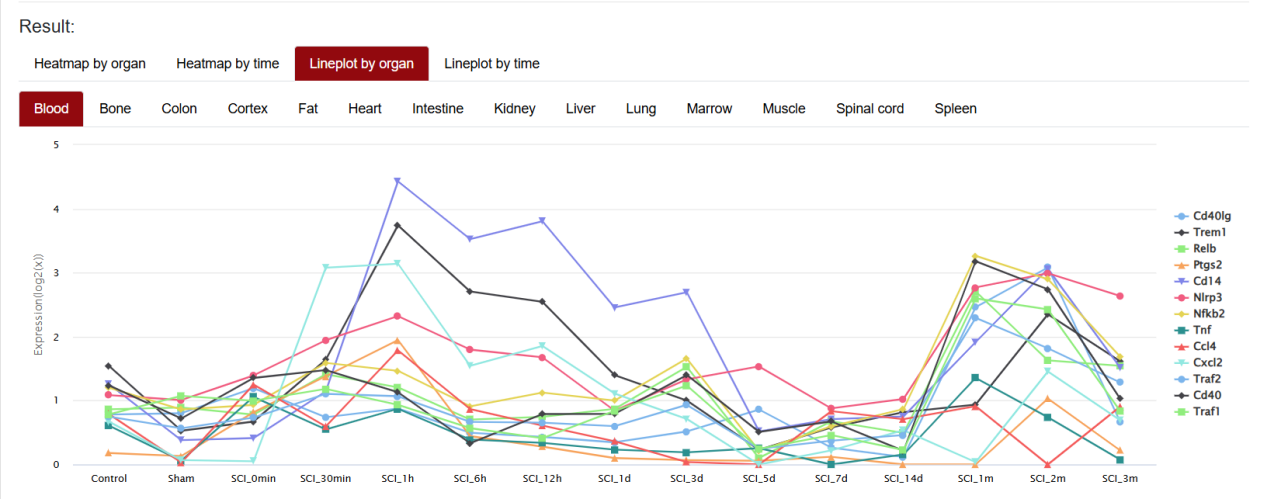
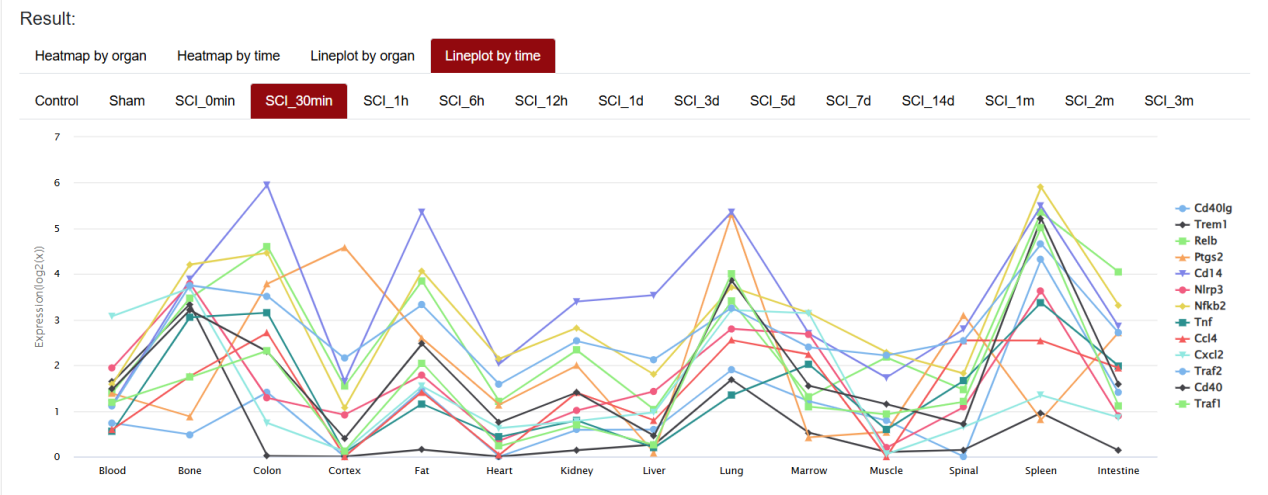
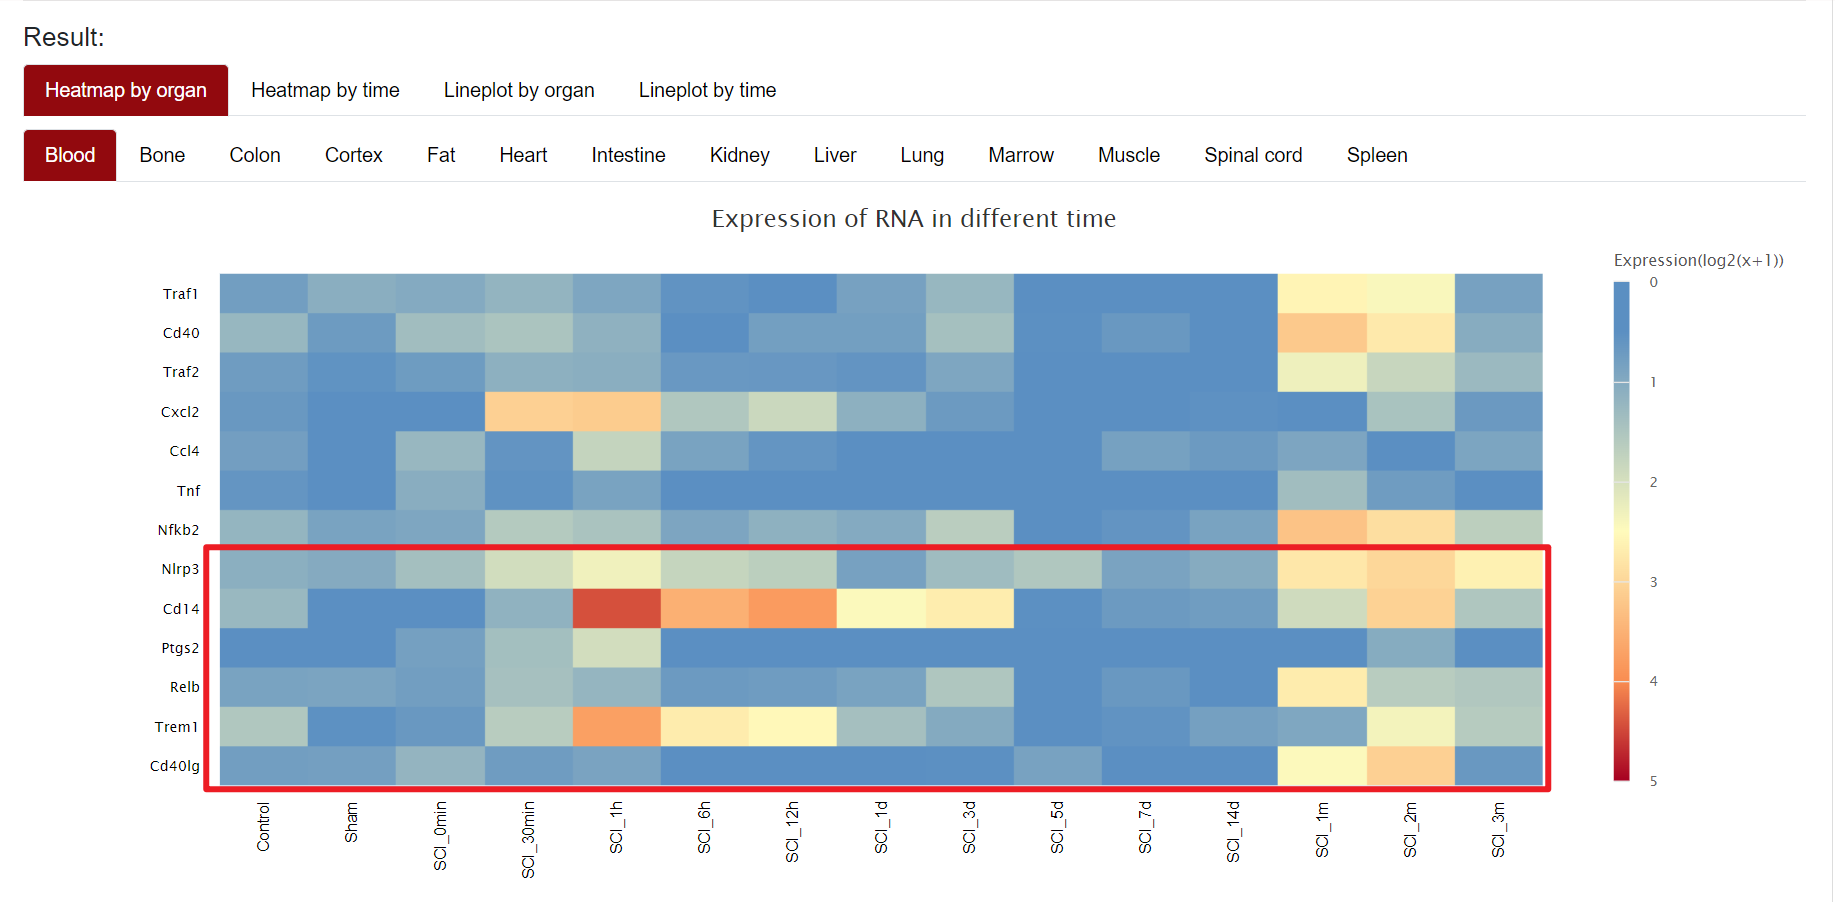
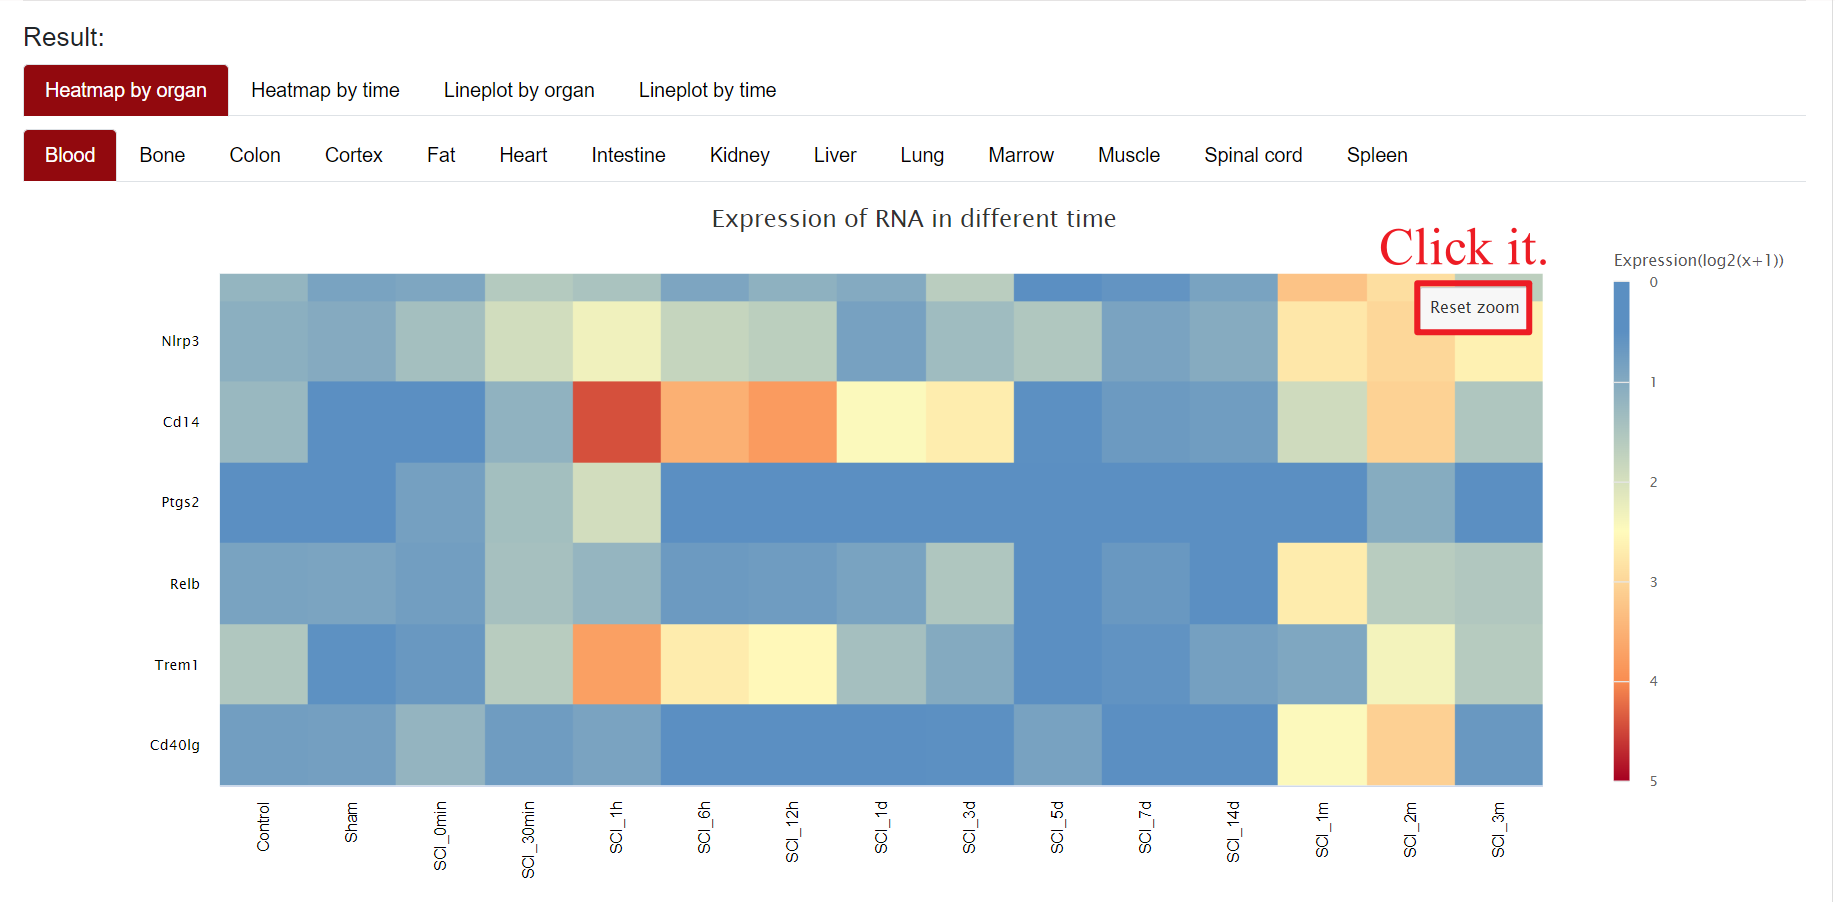
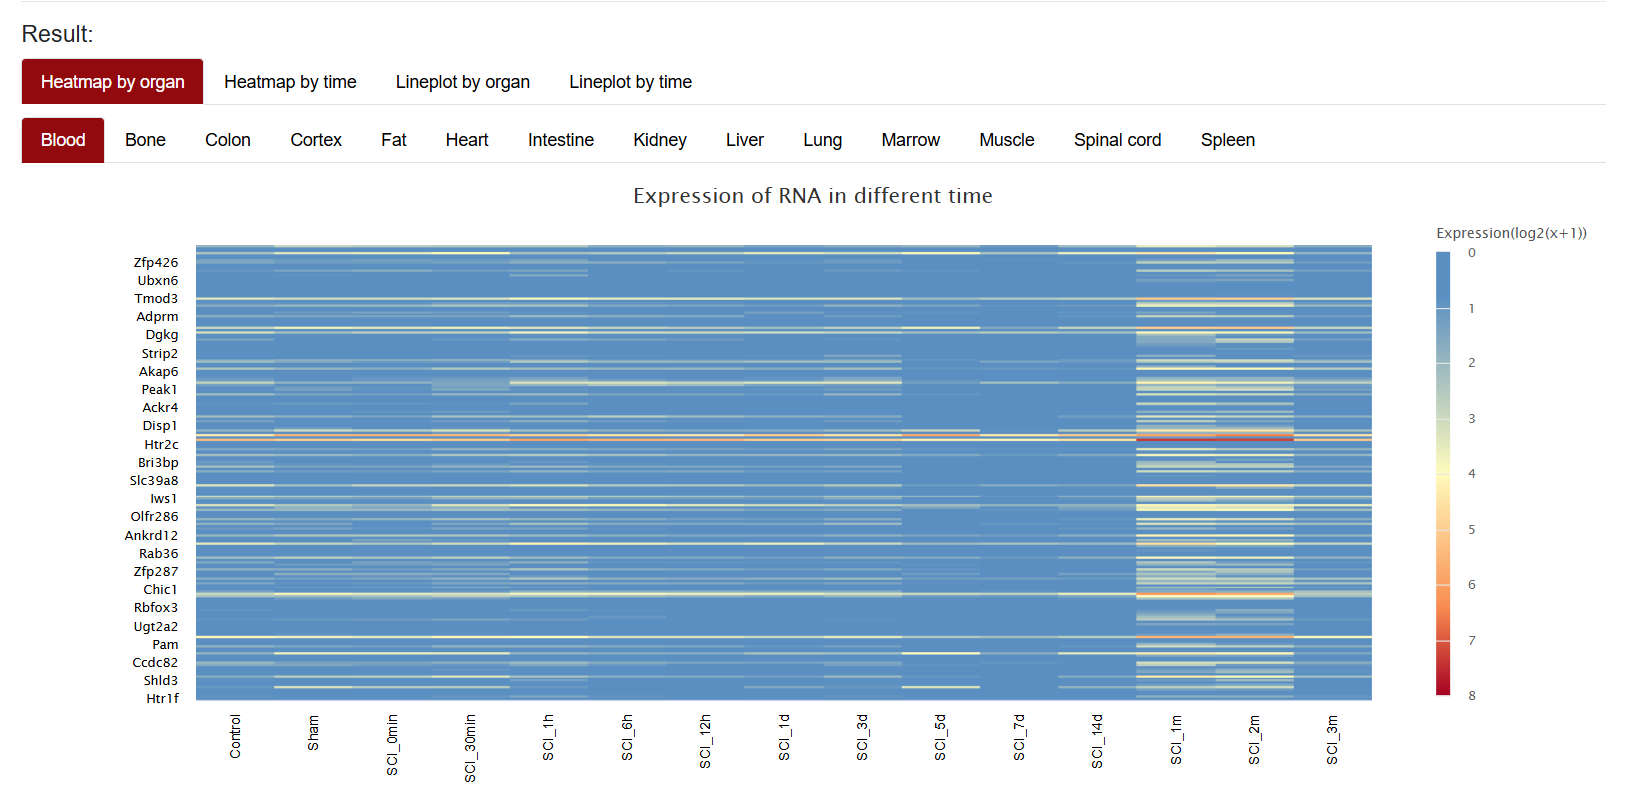
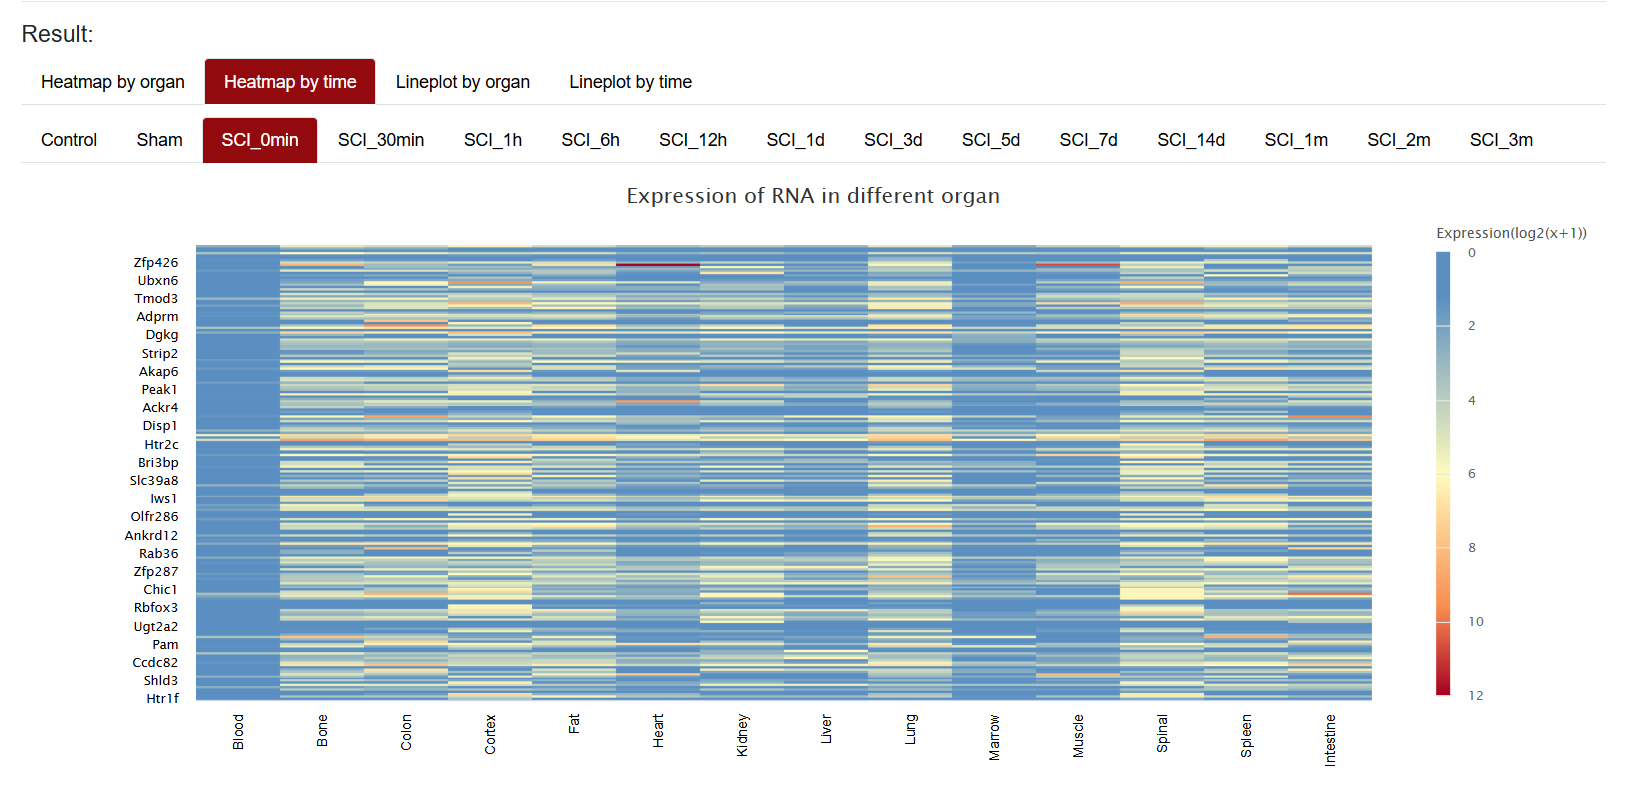
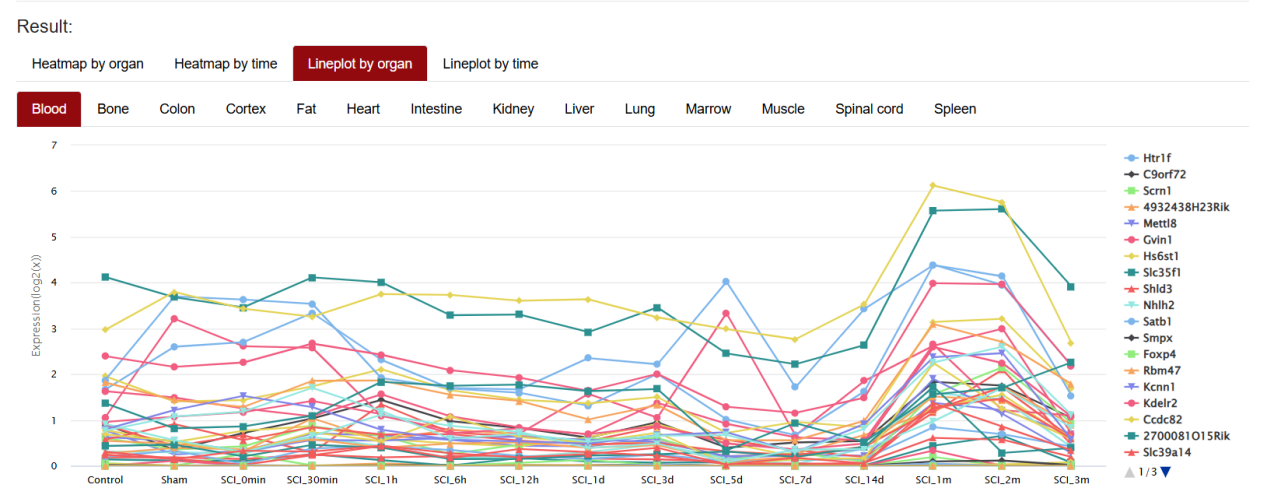
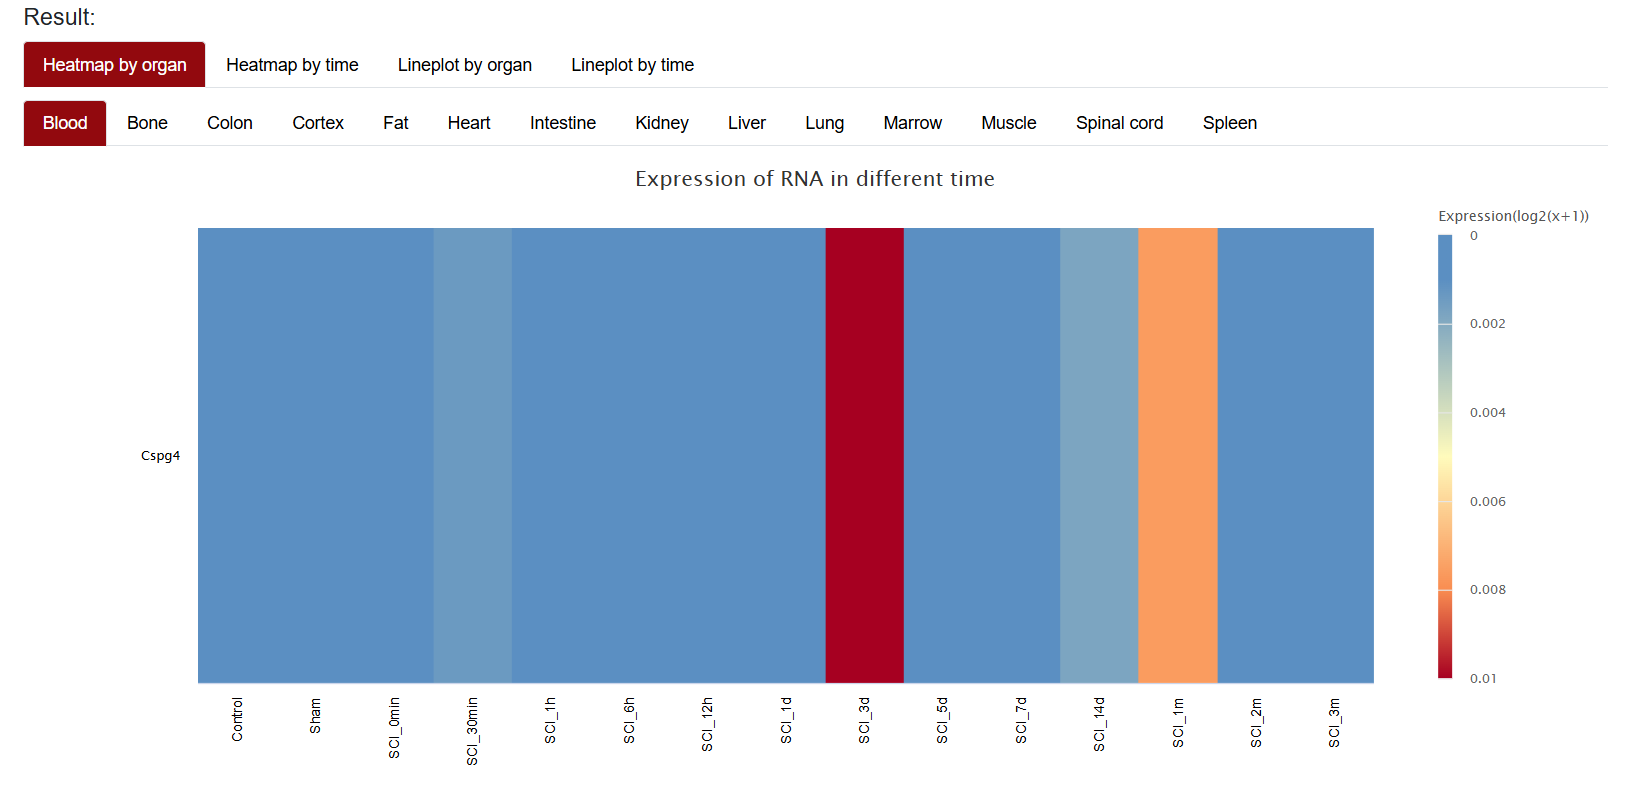
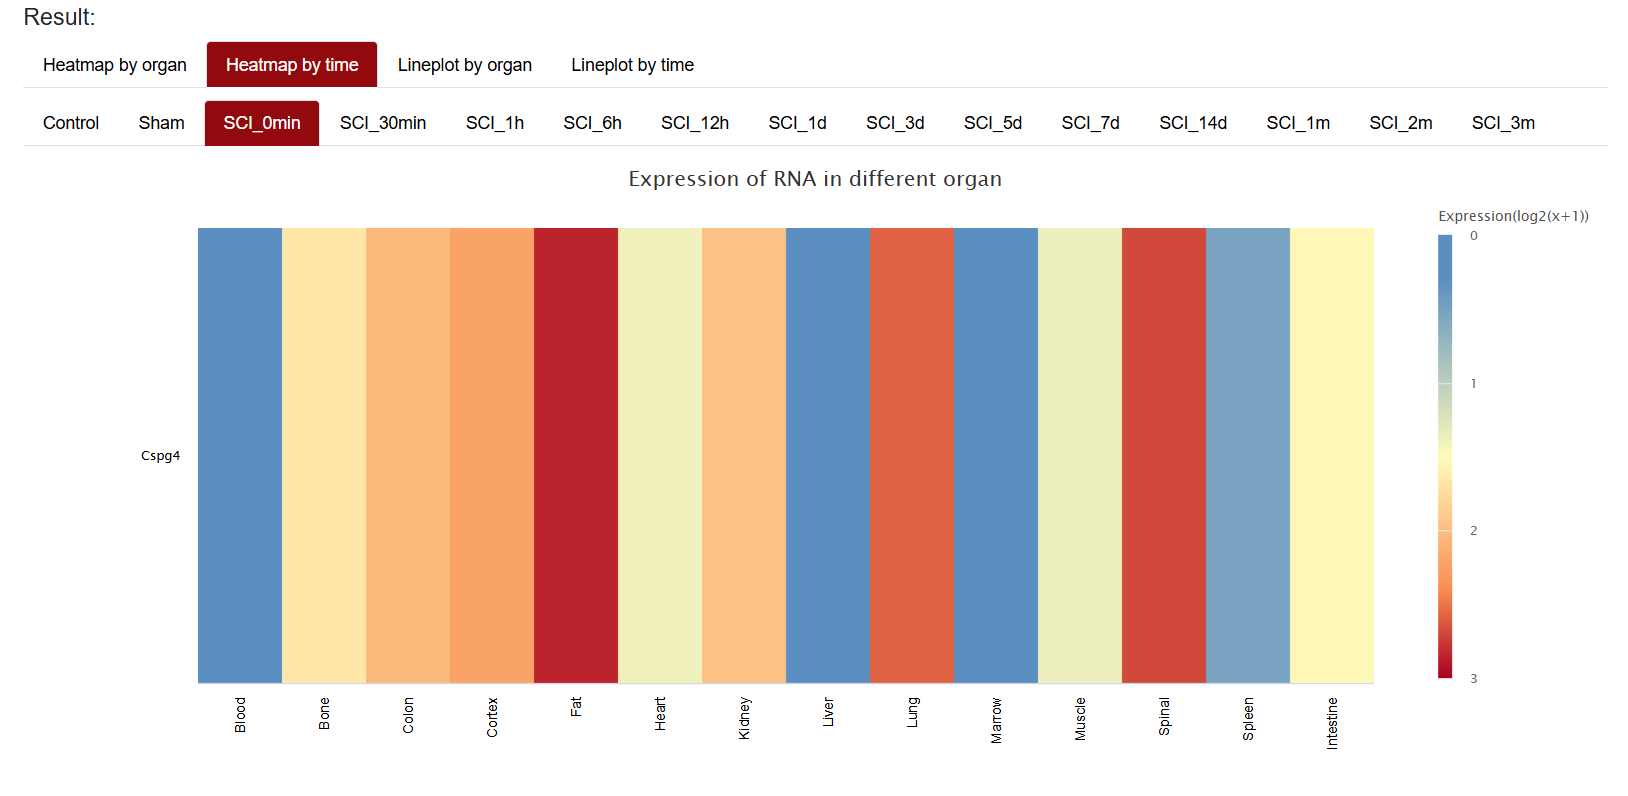
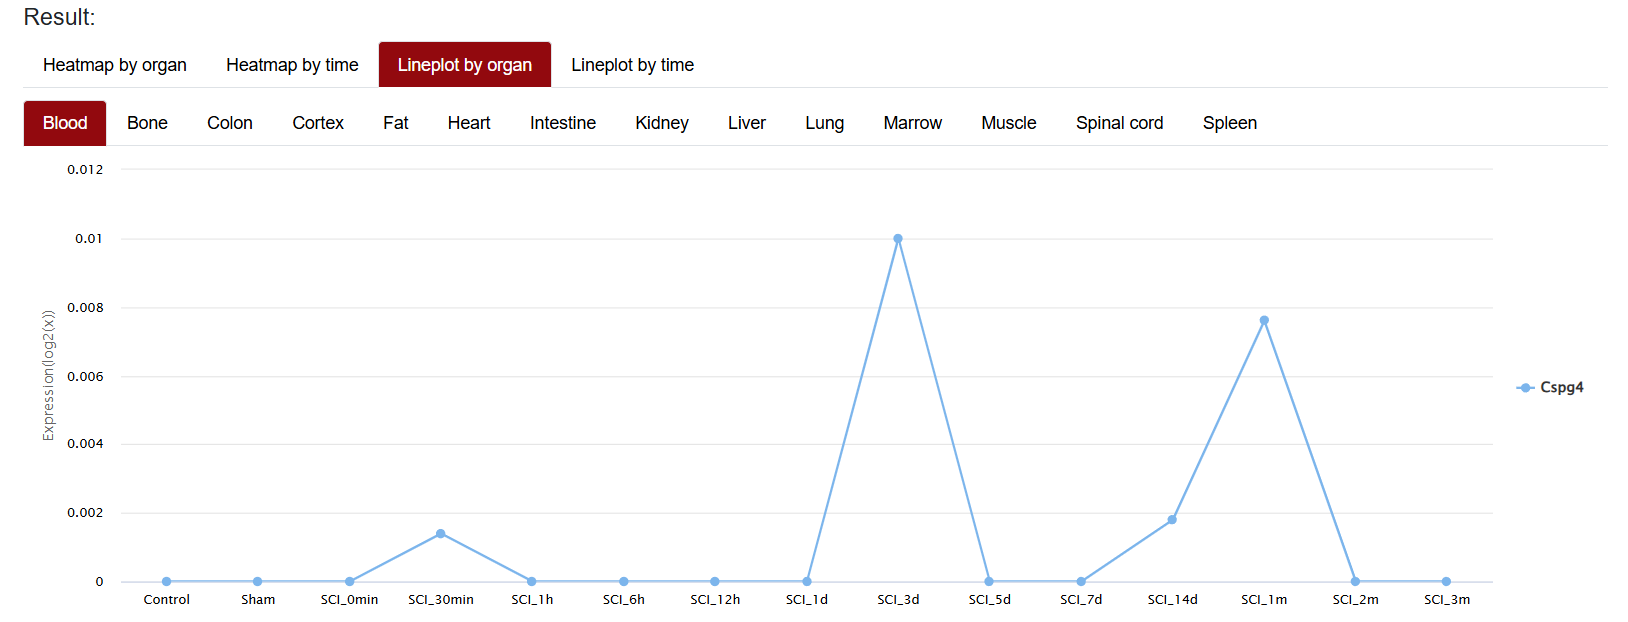
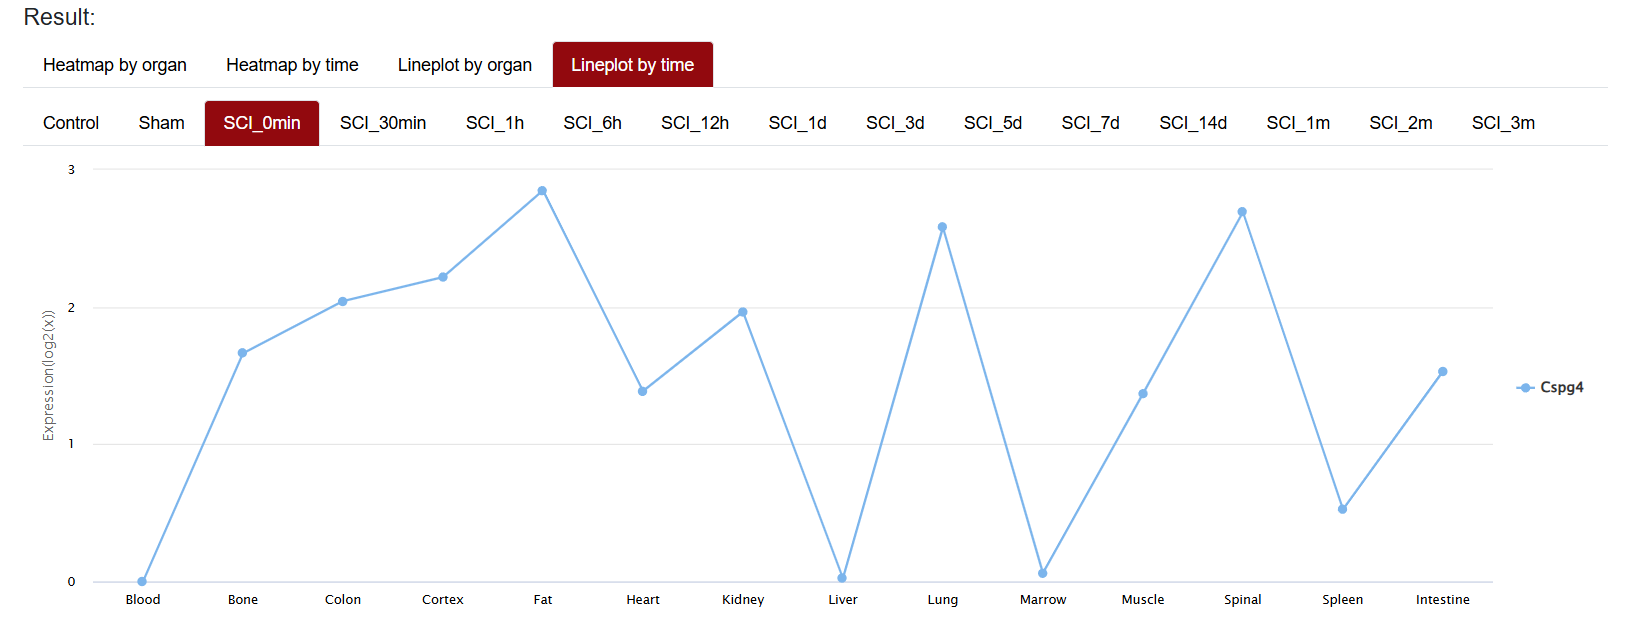
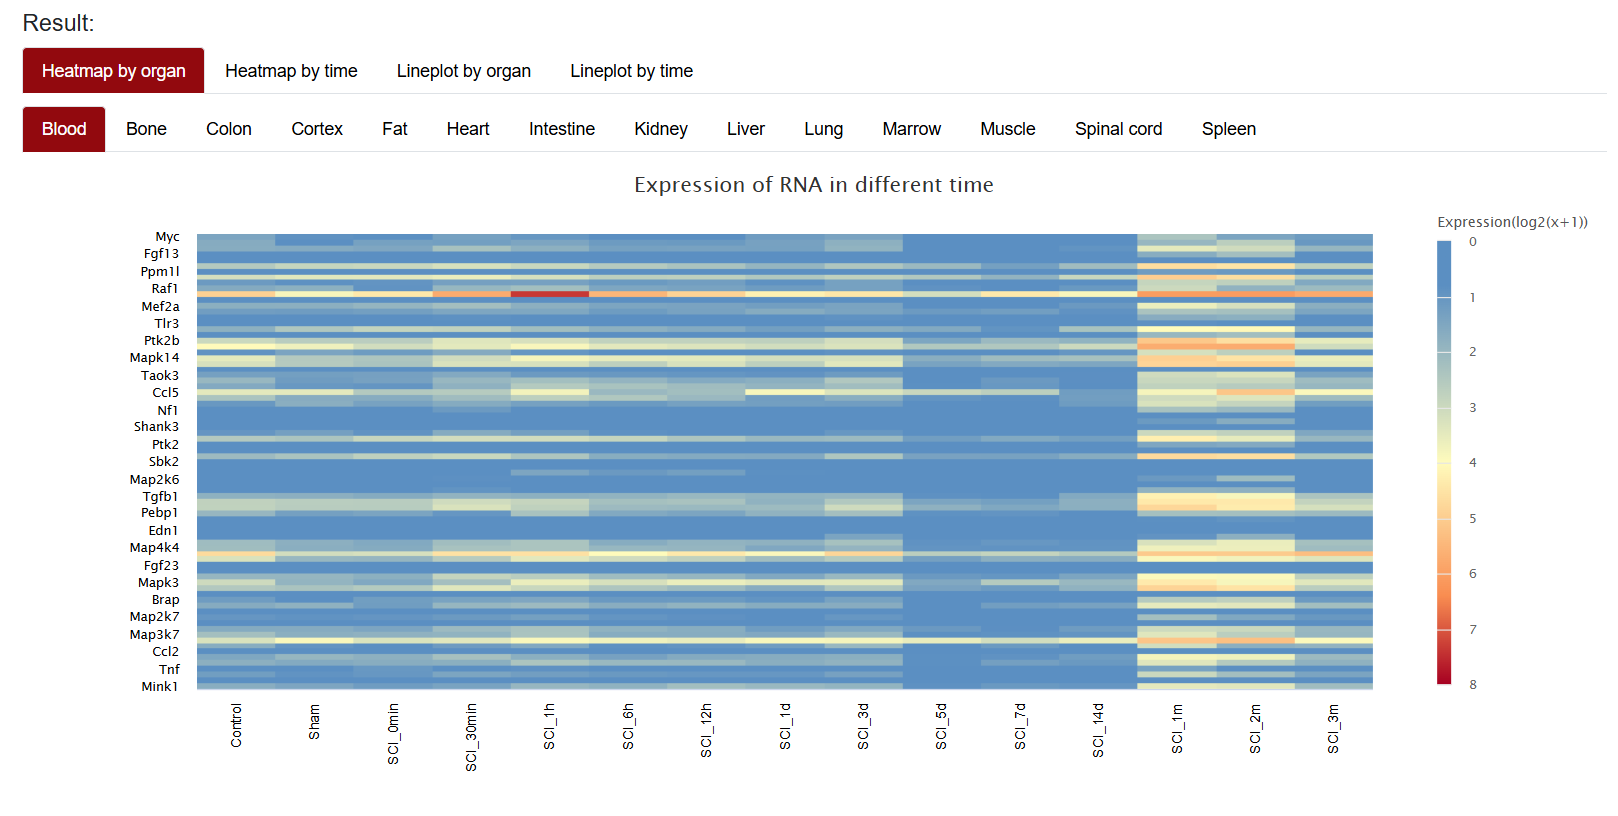
The search results are automatically visualized as heatmap and lineplot. In the top left corner of the figure, users can choose to view the heatmap by organ or time. Below these options, users can select different tissues or time points to refine the gene expression visualization. For instance, selecting "Heatmap by organ→Blood" will display the expression of the gene in blood at various time points. When "Heatmapt by time→SCI_0min" is selected, the page will display the expression of the gene in different organs at SCI 0min. Hovering over the heatmap or lineplot reveals specific statistical information.
Heatmap by organ
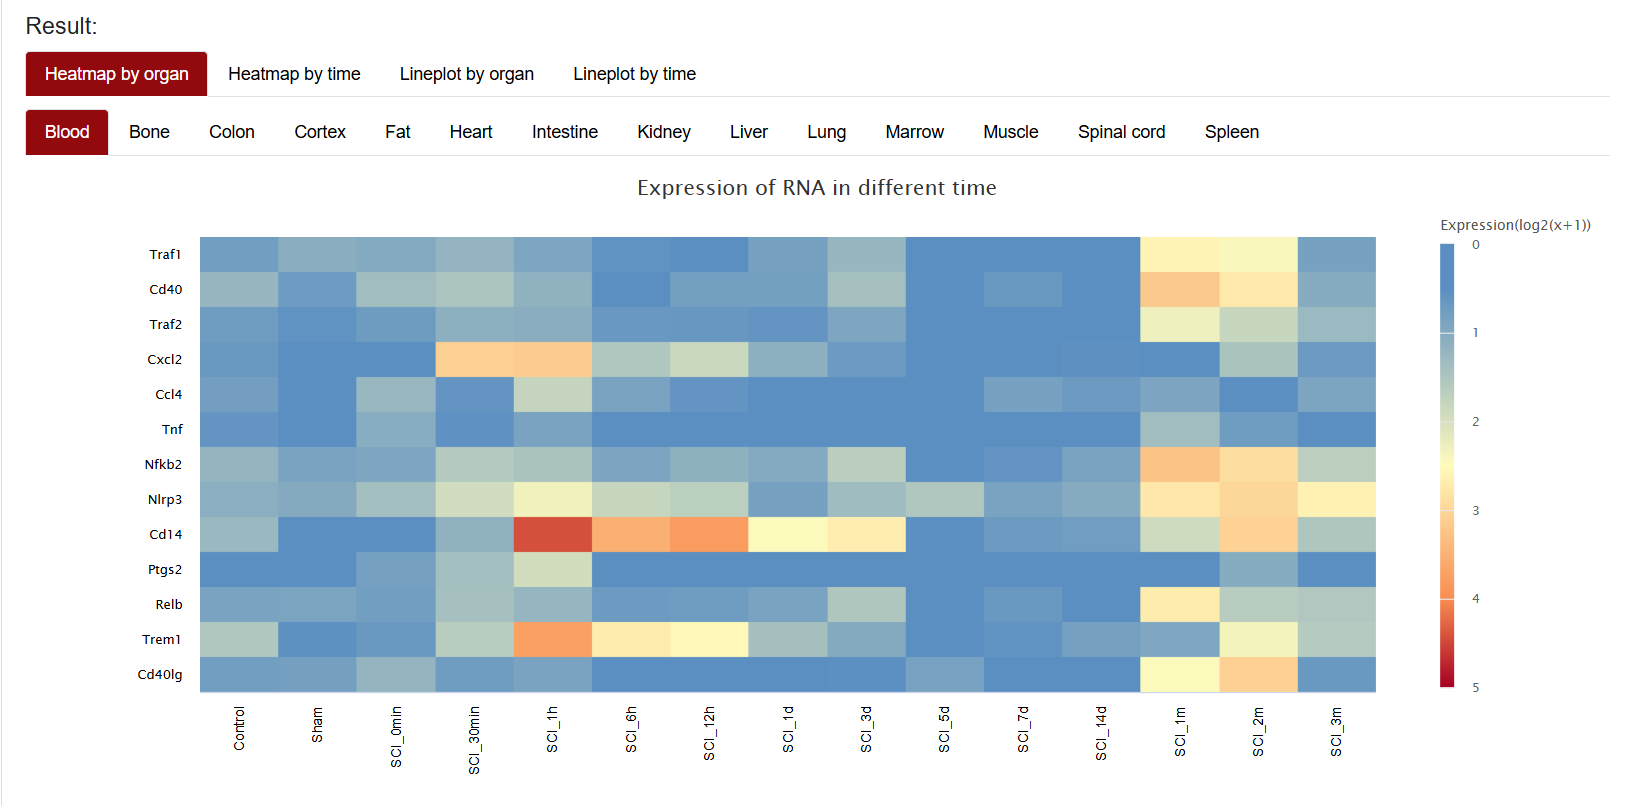
Heatmap by time
Lineplot by organ
Lineplot by time
When users want to zoom in on a certain part of the view, they can use the left mouse button to delineate the area you want to view, and the area will be zoomed in. When users want to restore the original view, they can click "Reset zoom". Similarly, the heatmap supports downloading in various formats.
Press and hold the left mouse button to zoom in.
Click Reset Zoom to restore the original Heatmap size
It should be noted that the presentation of Result is similar in Search by Gene lD, Search by miRNA ID, Search by Range, Search by Go lD, and Search by KEGG Pathway lD, thus we won't repeat the details here.
1.1.2 Search by miRNA ID
After clicking "Search by miRNA ID", SCIGAMA will redirect to a search interface where you can enter your target miRNA. Currently, the search box only supports one miRNA input. After the input is complete, click "Search" to proceed. Here SCIGAMA provides an example miRNA (mmu-miR-216a-5p) for reference. Users can enter it into the search box and click "Search" to proceed, SCIGAMA will give them the result below.
Please refer to 1.1.1 for the result description and figure download details.
Heatmap by organ
Heatmap by time
Lineplot by organ
Lineplot by time

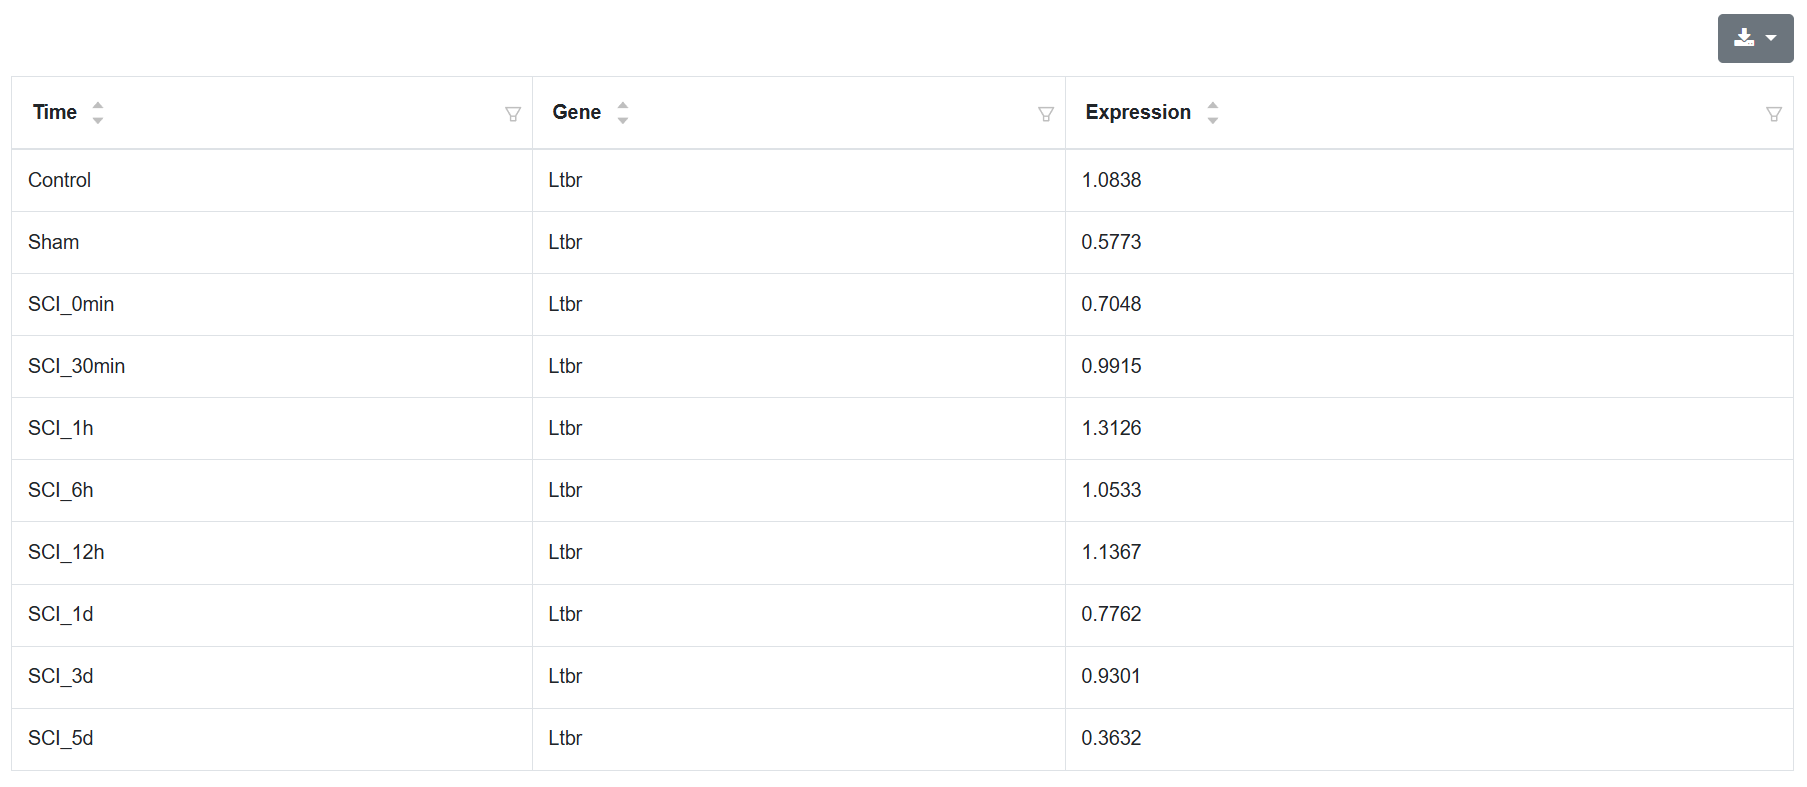
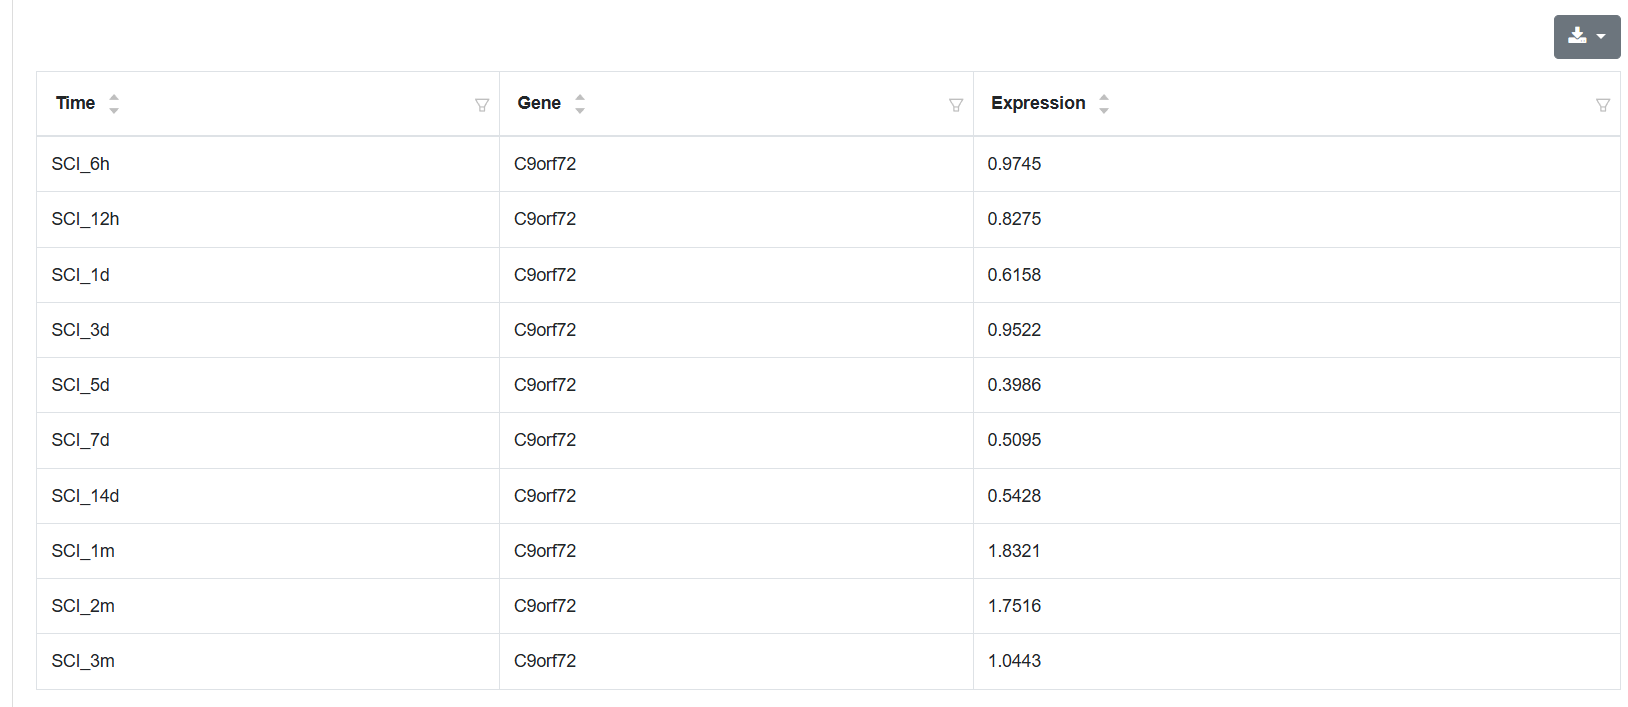
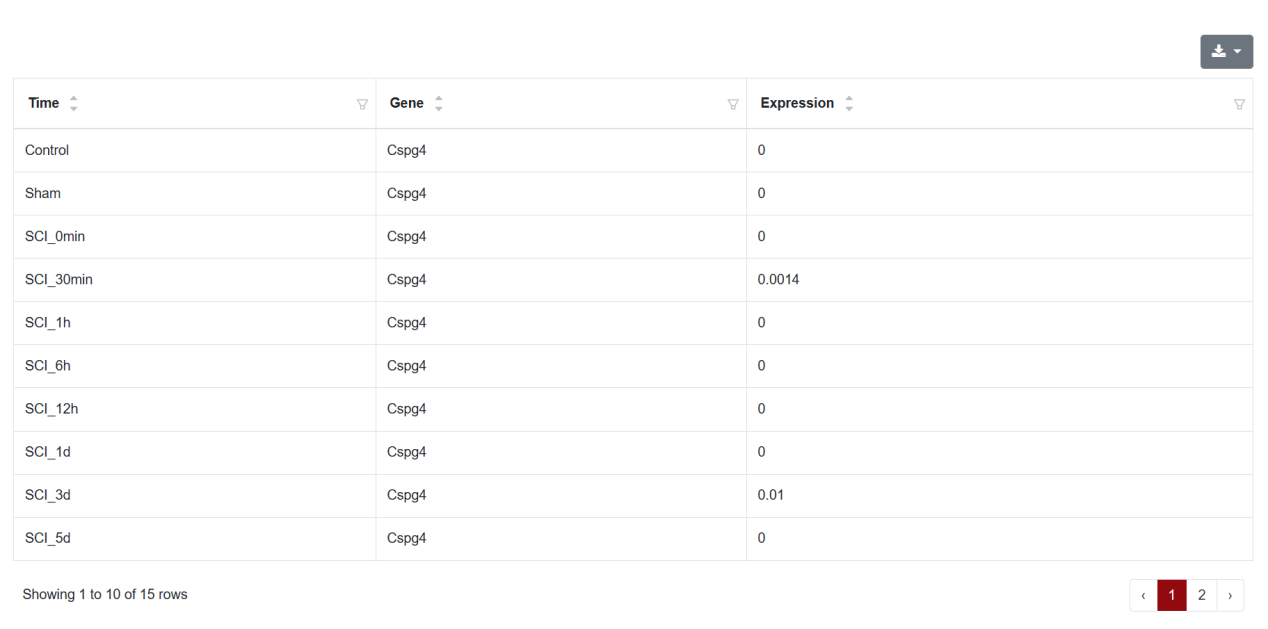
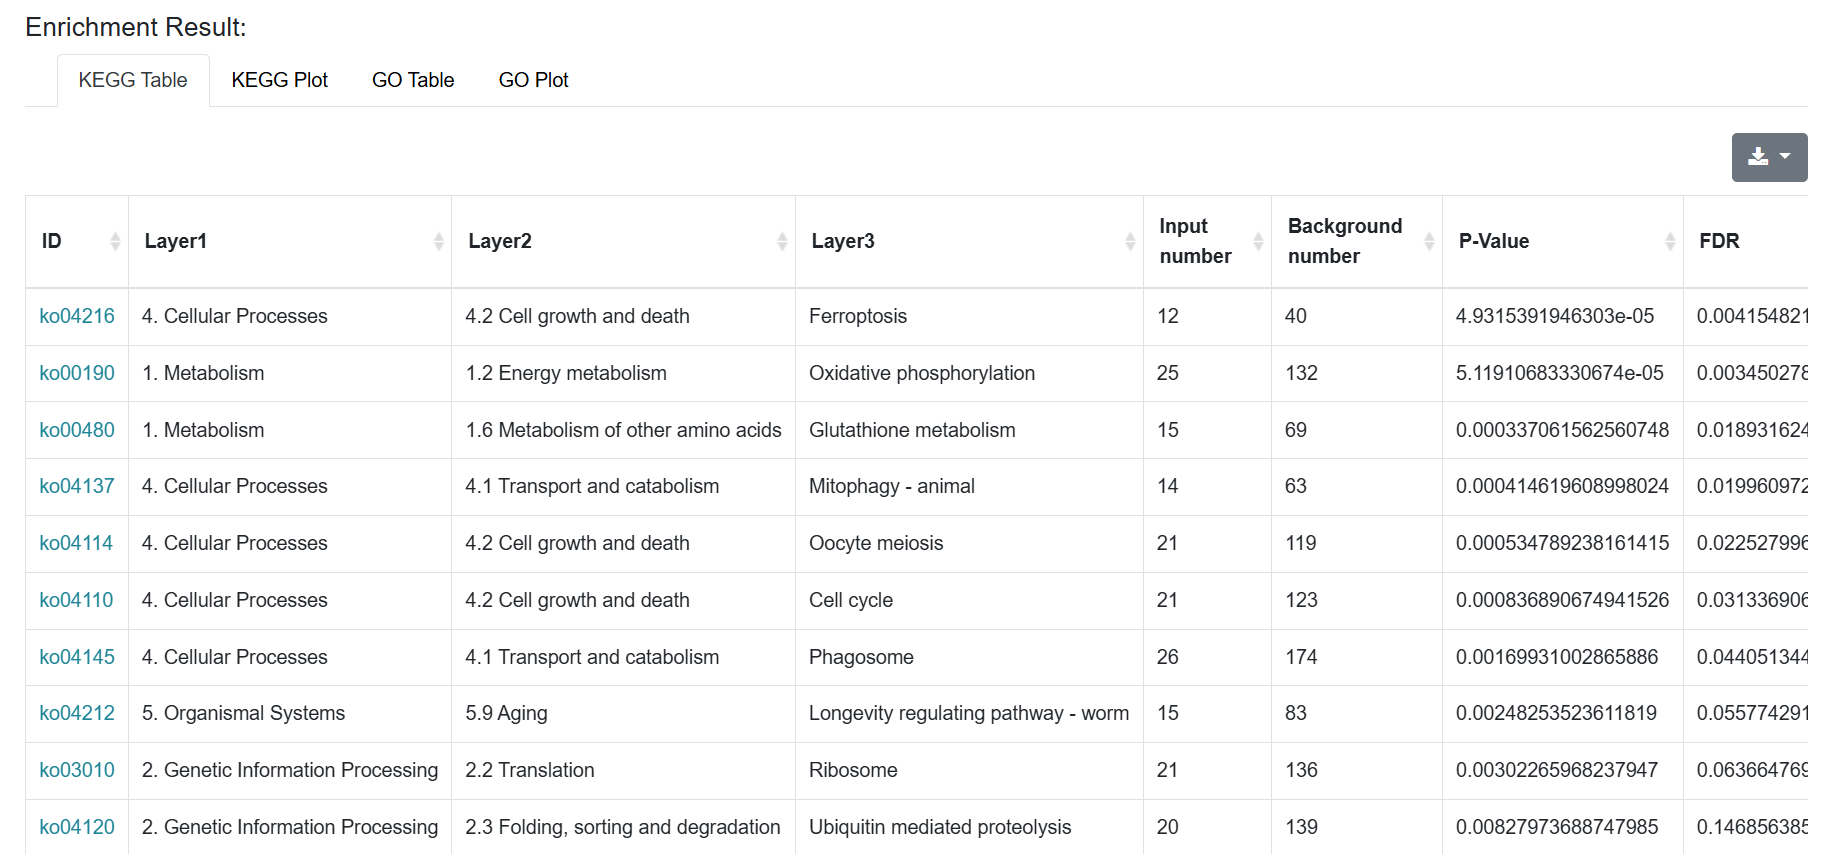
Below the Figure, SCIGAMA lists a Table. this Table lists the expression of this searched miRNA at different time points after SCI. the Time column indicates different time points after SCI. the Gene column indicates the gene regulated by this miRNA, and the Expression column illustrates the gene expression. Users can also download the table's data via the download button on the top right.
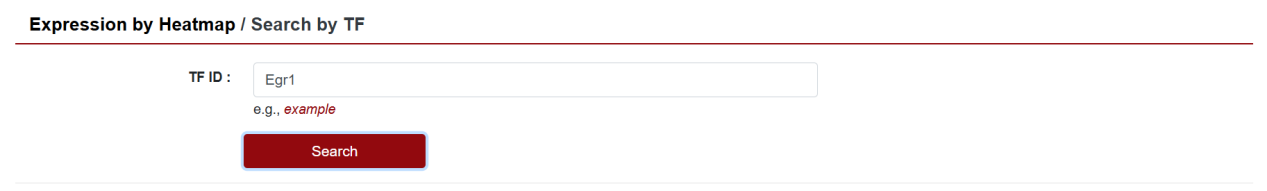
1.1.3 Search by TF
SCIGAMA supports transcription factor analysis. After clicking on "Search by TF", users will be taken to a screen with a search bar that allows them to search by transcription factor. The results of the transcription factor analysis are presented in the form of plots and tables. First, as in other sections, users can zoom in locally on the heatmap. The table shows the expression of transcription factor target genes at different time points. The Time column shows the group information, Gene represents the target gene, and Expression represents the expression of the gene. Users can also download the results of transcription factor analysis. Please refer to 1.1.1 for the result description and figure download details.
Heatmap by organ
Heatmap by time
Lineplot by organ
Lineplot by time
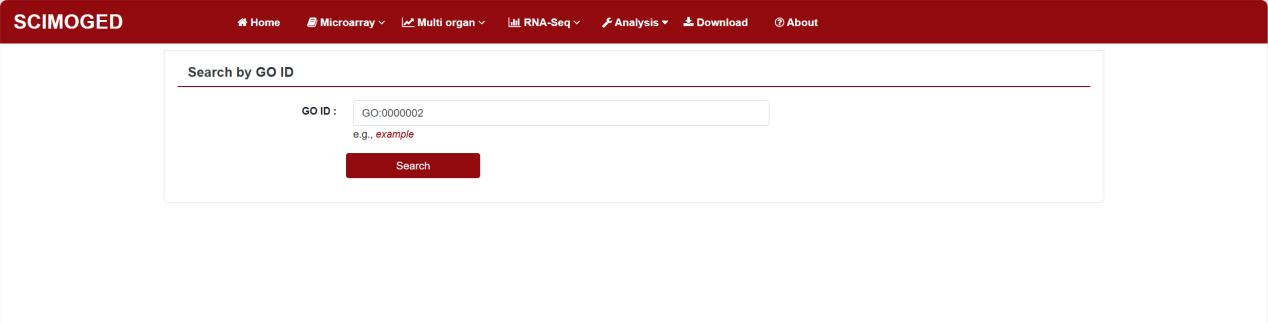
1.1.3 Search by GO lD
SCIGAMA also allows users to search by GO ID and make plots. After clicking "Search by GO lD", the database will jump to the search screen, where users can enter the GO ID or pathway name they want to search. It is worth noting that SCIGAMA supports Autocomplete. Here, SCIGAMA takes the example listed in the database as an example, enter GO:0000165 or MAPK/ERK and click search, SCIGAMA will give you the heatmap results related to GO:0000165(MAPK/ERK) at the bottom. When the user enters GO_ID, SCIGAMA supports character association to complete GO_ID. The results are presented in the form of heatmaps, lineplots and tables, and users can download the table data via the Download button on the top right. Please refer to 1.1.1 for the result description.
1.1.4 Search by KEGG Pathway lD
After clicking "Search by KEGG Pathway lD", SCIGAMA will jump to the search interface, where users can enter KEGG Pathway lD to search. Since the SCI sample species is C57BL/6, SCIGAMA is based on the mouse KEGG PATHWAY ID, such as "mmu.....". Here we use the example listed in the database as an example, enter mmu04064 and click “Search”, SCIGAMA will give users plot results involving mmu04064 pathway related genes at the bottom. Similarly, when the users enter KEGG Pathway lD, SCIGAMA supports character association to complete the KEGG Pathway lD.
SCIGAMA also allows users to search by KEGG Pathway lD and make plots. After clicking "Search by KEGG Pathway lD", the database will jump to the search screen, where users can enter the KEGG Pathway ID or pathway name they want to search. It is worth noting that SCIGAMA supports Autocomplete. Here, SCIGAMA takes the example listed in the database as an example, enter mmu04064 or NF-κB and click search, SCIGAMA will give users the results related to mmu04064 at the bottom. When the user enters KEGG Pathway lD, SCIGAMA supports character association to complete KEGG Pathway lD. Please refer to 1.1.1 for the result description and figure download details.