Click on “Transcriptome” in the navigation bar on the homepage. SCIGAMA will then pop up a submenu. Select the “Correlation” option in the ‘Analysis’ section of the submenu. SCIGAMA will pop up another submenu. In the navigation bar of the homepage, click "Correlation", SCIGAMA will bring up a sub-menu, and then click "Injured Co-Expression Network" or "Injured Gene Correlation Query" to carry out the analysis.
1. Injured Co-Expression Network
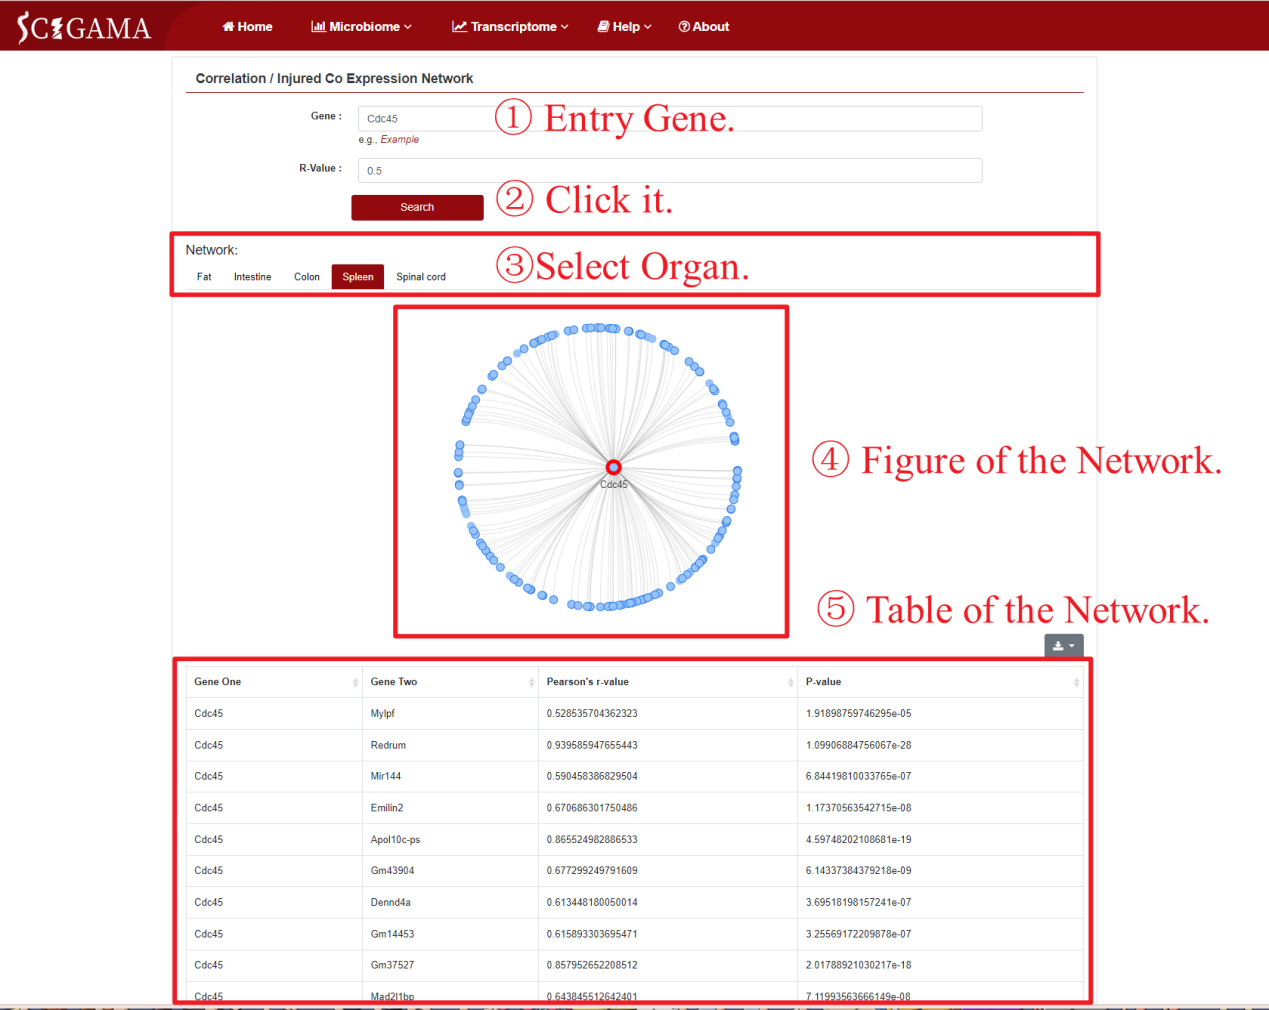
After clicking Injured Co Expression Network, SCIGAMA will redirect to a search interface, where users can enter the gene name or Ensembl ID of the target gene in the Search box. Once users have completed their search, SCIGAMA will construct a co-expression network based on their inputs.
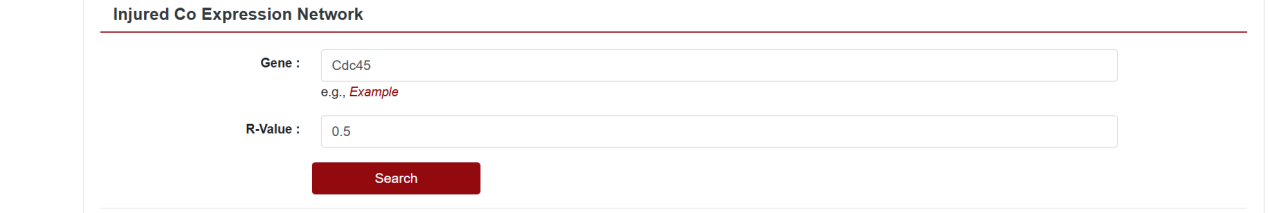
Using the example of SCIGAMA, enter gene name such as Cdc45, then click "Search". The resulting network will appear below. Users can filter the network by different tissues or organs to view the co-expression patterns of the selected genes. The network graph is zoomable using the mouse wheel, and hovering over gene points reveals gene names, corresponding Pearson's R values. Beneath the network, a table lists information about the selected gene, its associated genes, the respective Pearson's R-values and P-value. In the co-expression network figure, the selected genes are represented by red dot, and the blue dots are genes with which it has established relevance. Selected genes and candidate genes are considered to be related when the absolute value of Pearson's R value was greater than 0.50. Here we recommend that users set the value of Pearson's R value to 0.80. Absolutely, users can also set their own R value for screening. The results of the Co-Expression Network can be downloaded by clicking the Download button at the top right of the Table, currently supporting ".xls" and ".txt" formats.
2. Injured Gene Correlation Query
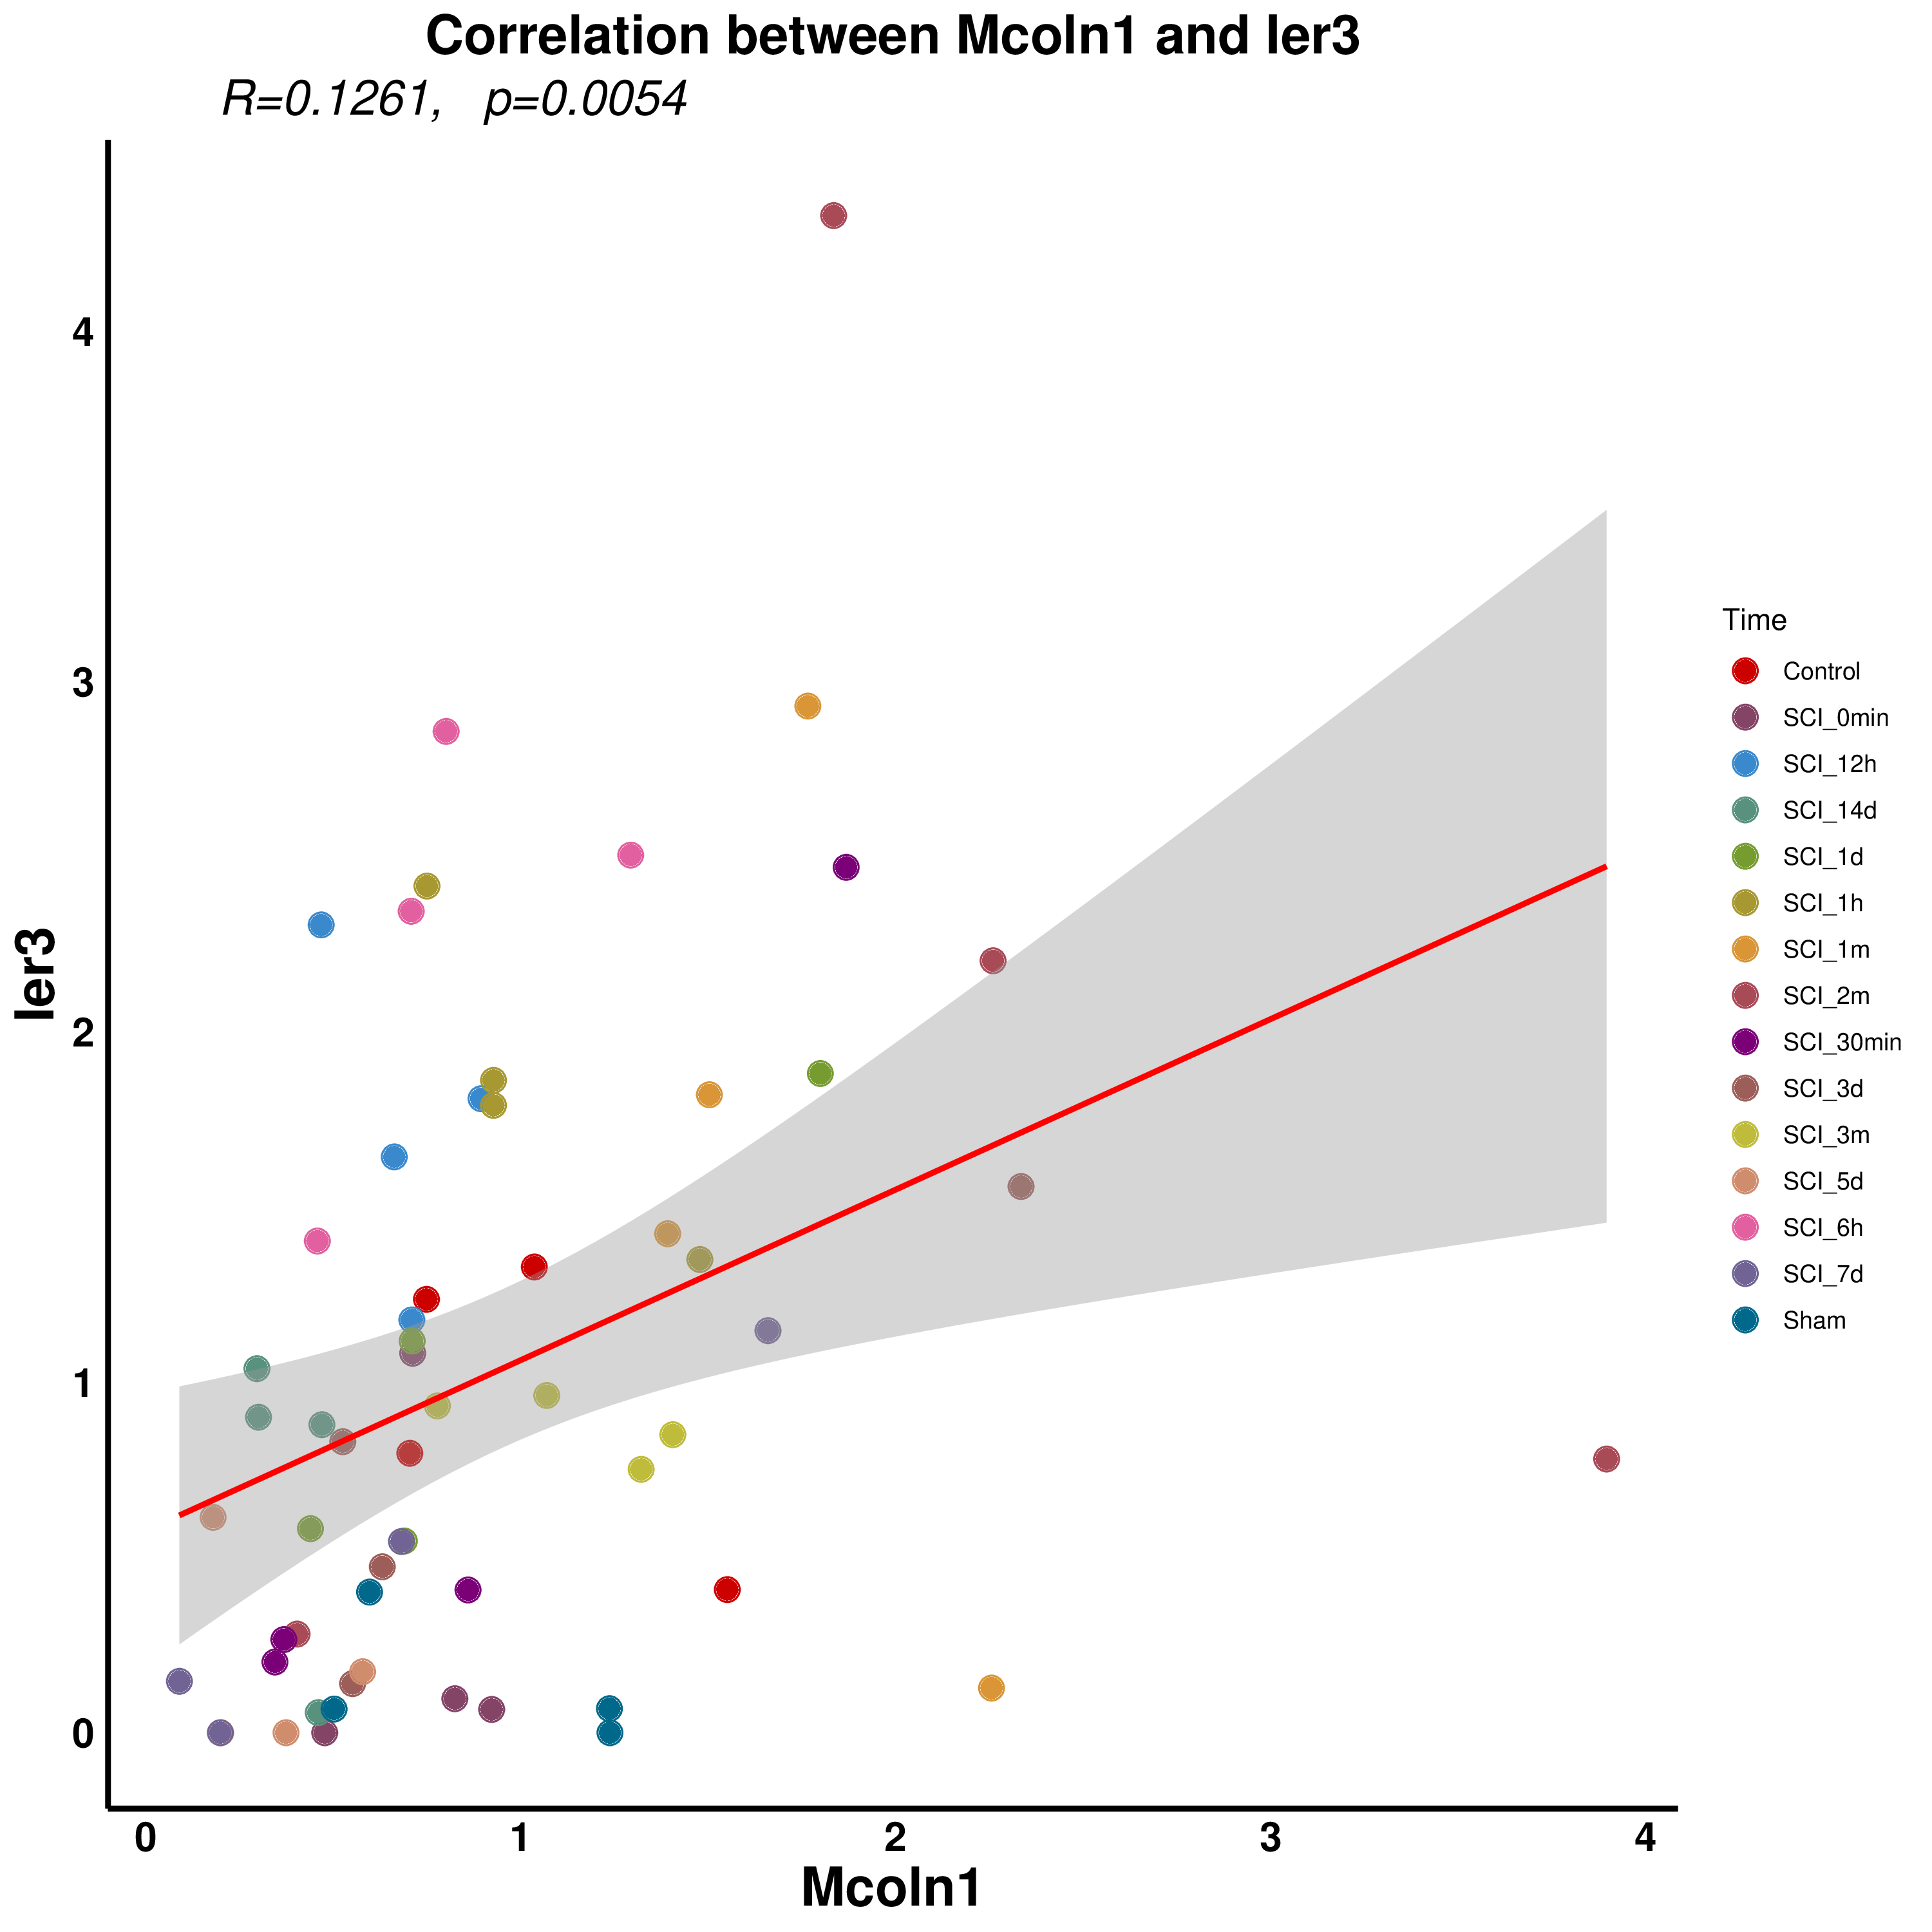
Potential correlations between injury-related genes may exist. In the "Injured Gene Correlation Query" section, SICMOGED provides a function to explore the correlation between two injury-related genes, which is demonstrated by a linear regression plot. Users can set the two genes to be correlated as Gene1 and Gene2, representing the independent and dependent variables respectively. At the same time, the user also needs to set the test tissue, such as blood or spinal cord. When the settings are complete, click Search, and after a short wait, the page will display the correlation Plot at the bottom.
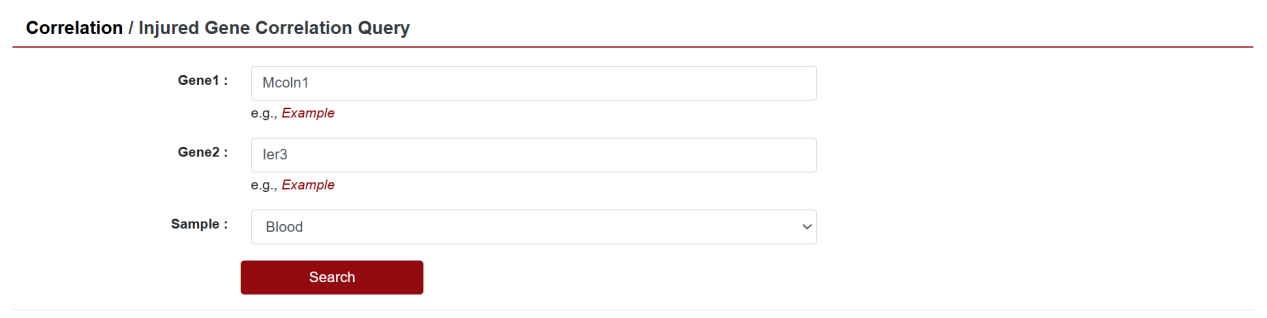
In the Correlation Plot, the X-axis represents the expression level of Gene1, while the Y-axis represents the expression level of Gene2. Each colored dot in the plot represents a sample, and its position (X, Y) directly reflects the expression level of the two genes in that sample. The red line represents is a linear regression fit line, which reveals the linear relationship between Gene1 expression level and Gene2 expression level. The gray area then represents the confidence interval of the fitted line. The linear regression equation will be labelled at the bottom right of the Figure, and this linear regression R-value and p-value are labelled at the top left.